Every internal support team, whether in IT, HR, or Operations, eventually faces the same challenge. The queue of requests grows, priorities become muddled, and the team is forced into a constant state of reactive firefighting. Urgent issues get lost in a sea of minor requests, deadlines are missed, and the business teams who depend on this support grow frustrated. This operational friction doesn’t just slow down work; it creates a cycle of inefficiency that is difficult to break with manual processes alone.
The solution isn’t simply to hire more people or ask them to work harder. The solution is to gain visibility. A well-designed support triage dashboard transforms a chaotic inbox into an operational command center. It provides a single source of truth that helps you understand your backlog, proactively manage service level agreements (SLAs), and, most importantly, identify the root causes of recurring problems before they overwhelm your team. This isn’t about fancy charts; it’s about making data-driven decisions that directly improve speed, service quality, and cost-efficiency.
From Reactive Firefighting to Proactive Problem-Solving
For many organizations, support triage is a manual and often subjective process. A manager or team lead scans a queue of tickets, relying on keywords in the subject line or their own intuition to assign priority. This approach is fraught with risk. High-priority issues from a critical business unit can be overlooked, while low-impact but “noisy” requests get immediate attention. The team spends its day reacting to the latest crisis, never getting ahead of the curve.
A support triage dashboard fundamentally changes this dynamic. By consolidating data from your ticketing systems (like Jira or Zendesk), communication channels (like email or Slack), and other business applications (like a CRM), it presents a unified, real-time view of your entire support landscape. Instead of guessing, you know. Instead of reacting, you can anticipate.
This shift has a profound impact on business value. When a support function operates with clarity, it ceases to be a simple cost center. It becomes a source of vital business intelligence. It can tell you which software tools are causing the most friction for your sales team, what company policies are most confusing to new hires, or which suppliers are consistently submitting flawed invoices. This intelligence allows the business to solve systemic problems, not just individual tickets, driving meaningful improvements in productivity and reducing long-term operational costs.
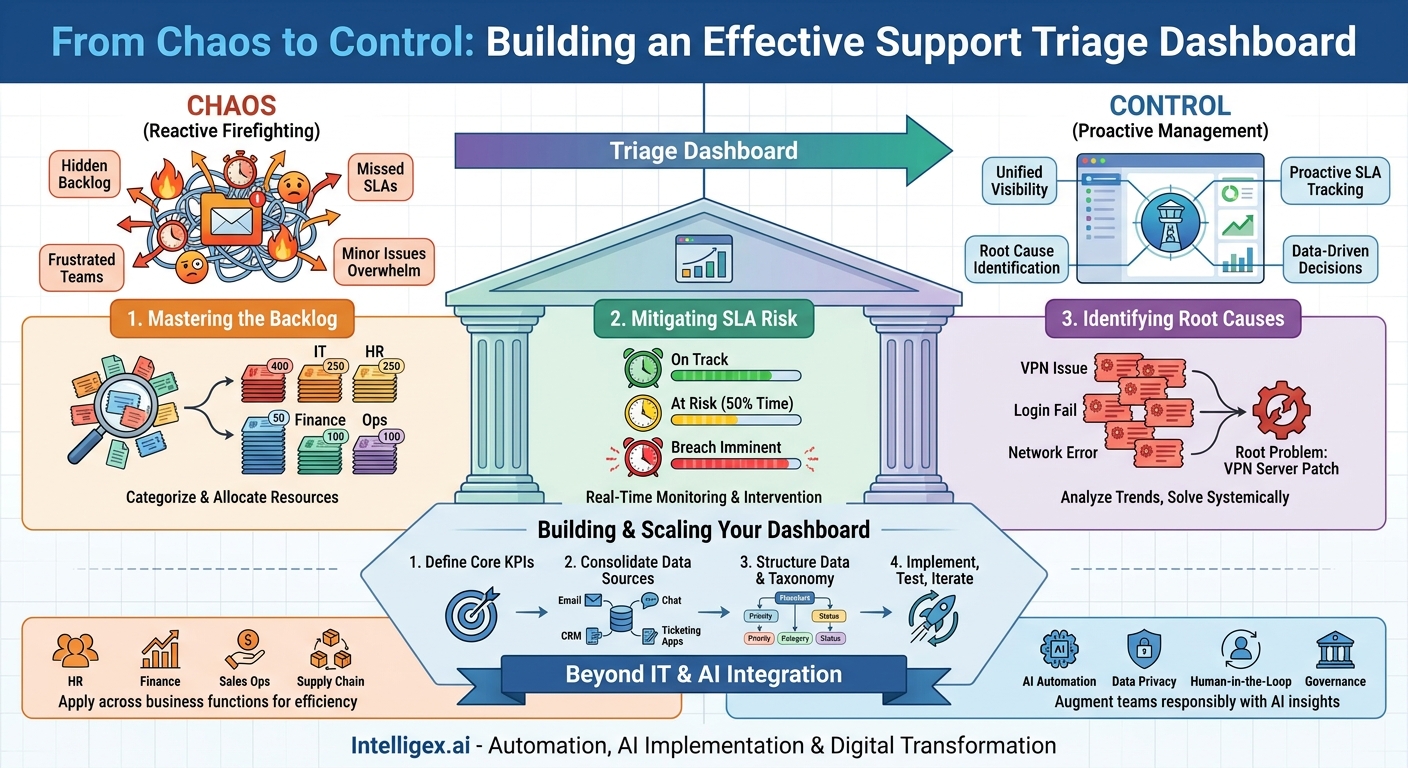
The Three Pillars of an Effective Triage Dashboard
A powerful triage dashboard is built on three essential components that work together to provide a comprehensive operational picture. Each pillar answers a critical question for support managers and team leads: What are we working on? What is at risk? And where can we improve?
Pillar 1: Mastering the Backlog
The backlog is the total sum of all open requests. Without a clear way to visualize and segment it, it can feel like an intimidating, monolithic block of work. A dashboard brings order to this chaos by allowing you to slice and dice your backlog in real time.
Instead of just seeing “1,500 open tickets,” you can instantly see the breakdown. For an IT team, this might be 400 password resets, 250 access requests, 50 critical server alerts, and so on. This immediate categorization allows for intelligent resource allocation. You can assign junior team members to the high-volume, low-complexity tasks, freeing up senior engineers to focus on the truly critical issues.
Practical Application: An HR operations team manages employee inquiries. Their dashboard shows the backlog categorized by request type. A week before the benefits enrollment deadline, they notice a sharp spike in tickets tagged with “enrollment system error.” This isn’t just an anecdote from one or two employees; it’s a clear data trend. The team can immediately escalate the issue to the IT vendor and proactively send a company-wide communication with a workaround, preventing hundreds of additional tickets and reducing employee anxiety.
Pillar 2: Mitigating SLA Risk
Service Level Agreements are the promises your team makes to the business. Breaching an SLA erodes trust and, in some cases, can have contractual or financial consequences. A triage dashboard acts as an early warning system, helping you manage these commitments proactively.
This component constantly monitors every open ticket against its defined SLA for metrics like time-to-first-response and time-to-resolution. It uses visual cues, such as color-coding, to flag tickets that are approaching their deadline. A ticket might start as green, turn yellow when it has reached 50% of its allotted time, and turn red when a breach is imminent. This allows managers to intervene strategically. They can reassign a ticket at risk, provide support to the current owner, or manage expectations with the person who submitted the request.
What to Measure:
- SLA Attainment Rate: The percentage of tickets resolved within their target SLA.
- Time to First Response: How quickly an agent engages with a new ticket.
- Time to Resolution: The total time from ticket creation to final resolution.
- Tickets at Risk: A real-time count of tickets currently in a “yellow” or “red” state.
Pillar 3: Identifying Top Issues and Root Causes
This is the most strategic pillar. While the first two pillars help you manage the current workload, this one helps you reduce future work. By analyzing historical and real-time ticket data, the dashboard can identify and cluster recurring issues.
Modern dashboards often use AI, specifically natural language processing, to look beyond simple tags and understand the content of the tickets themselves. It can group together dozens of differently worded requests that all point to the same underlying problem. For example, it might identify a cluster of tickets containing phrases like “cannot connect to VPN,” “VPN login failed,” and “network access denied from home.”
This insight is invaluable. Instead of your team solving the same VPN issue 50 different times for 50 different people, you can focus on fixing the root cause. The resolution might be a better knowledge base article, a system patch, or a training session. By solving the problem once at its source, you eliminate a significant volume of future tickets, freeing up your team for more complex and valuable work. This directly translates to cost savings and increased operational scalability.
Building Your Triage Dashboard: A Phased Approach
Creating an effective triage dashboard is not just a technical project; it’s an operational one. It requires careful planning and a clear understanding of the business outcomes you want to achieve. Rushing the process or focusing only on the technology often leads to a dashboard that looks impressive but provides little practical value. Follow these steps to ensure a successful implementation.
- Define Your Core Metrics and KPIs. Before you connect a single data source, ask the most important question: What do we need to know to perform better? Avoid the temptation to measure everything. Focus on a handful of key performance indicators (KPIs) that align directly with your business goals. For a finance team, a key metric might be “invoice processing time,” while for a sales operations team, it could be “contract review turnaround time.” Start with the end in mind.
- Consolidate Your Data Sources. Identify every system where support requests originate or are managed. This often includes official ticketing platforms like Salesforce Service Cloud or Jira, but may also include shared email inboxes, messaging platforms, or even spreadsheets. Document where the data lives and assess its quality and accessibility. Are there well-defined APIs you can use? Is the data structured consistently?
- Structure the Data Model and Taxonomy. This is the most critical step. A dashboard is only as good as the data it’s built on. You must establish a consistent and logical system for categorizing, prioritizing, and tagging tickets. This “taxonomy” is the language your dashboard will speak. For example, all requests should have a clear priority level (e.g., P1-P4), a category (e.g., Hardware, Software, Policy), and a status (e.g., Open, In Progress, Resolved). Using AI-powered tools to automate tagging based on ticket content can greatly improve consistency and reduce the manual burden on your team.
- Design the User Interface for Action. The dashboard’s design should be driven by its users. A front-line support agent needs a different view than a department head. An agent needs a clear, prioritized list of their assigned tickets with SLA timers prominently displayed. A manager needs to see team-level performance, backlog trends, and SLA risk across the entire department. Design separate views or personas to ensure every user gets the information they need to take action, without unnecessary clutter.
- Implement, Test, and Iterate. Don’t aim for perfection on day one. Start with a Minimum Viable Product (MVP) for a single team or a specific type of request. A pilot launch allows you to gather real-world feedback and make adjustments before a full-scale rollout. Support operations are dynamic, and your dashboard should be as well. Establish a regular process for reviewing its effectiveness and making iterative improvements based on user feedback and changing business needs.
Beyond IT Support: Triage Dashboards Across the Business
While the concept of a support dashboard originated in IT, its principles are universally applicable to any function that handles a queue of internal or external requests. Applying this model to other business units can unlock significant efficiency gains across the entire organization.
Human Resources: An HR operations team can use a dashboard to manage employee inquiries related to payroll, benefits, leave policies, and onboarding. By analyzing trends, the dashboard can highlight which parts of the employee handbook are most confusing or which benefits require better communication, allowing HR to proactively address issues before they become widespread problems.
Finance and Accounting: For an Accounts Payable team, a dashboard can triage incoming vendor invoices and payment queries. It can automatically flag invoices that are missing purchase order numbers or are from unapproved vendors. This speeds up processing for valid invoices and provides clear data on which vendors are causing the most administrative friction.
Sales Operations: A Sales Ops team acts as a support function for the sales organization, handling requests for quotes, contract generation, and CRM assistance. A triage dashboard helps them prioritize requests from high-value deals and identifies bottlenecks in the sales support process, helping to shorten the sales cycle.
Supply Chain: In a supply chain context, a dashboard can manage inquiries from logistics partners, distributors, and internal stakeholders about order status, shipment delays, or inventory levels. By clustering tickets by location or shipping lane, the team can quickly identify and react to systemic issues, such as a problem at a specific port or warehouse.
A Practical Checklist for Implementation
As you plan your initiative, use this checklist to ensure you cover the essential business and operational groundwork before diving into the technical details.
- Secure Executive Sponsorship: Identify a leader who understands the business value and will champion the project, helping to secure resources and drive adoption.
- Define the Core Business Problem: Be specific. Is your goal to reduce resolution time for critical issues by 25%? Or to decrease the volume of password reset tickets by 40%? A clear goal focuses the project.
- Assemble a Cross-Functional Team: Your team should include representatives from the business unit using the dashboard, IT, and any data or business intelligence specialists. This ensures all perspectives are considered.
- Map Your Data Sources: Create a complete inventory of where requests are managed. Note the systems, like Atlassian’s Jira or Zendesk, and assess the quality and accessibility of the data in each.
- Develop a Clear Taxonomy: Before you build, agree on a universal set of categories, priorities, and statuses. Get buy-in from the team that will be using it daily.
- Plan a Phased Rollout: Select a pilot group to test the initial version of the dashboard. Their feedback will be invaluable for refining the tool before a wider launch.
- Establish a Feedback Loop: Schedule regular check-ins after launch to discuss what’s working, what’s not, and what new features or data points would add more value.
AI, Governance, and Responsible Implementation
Integrating AI into your triage dashboard can unlock powerful capabilities like automated ticket categorization, sentiment analysis, and predictive SLA warnings. However, this technology must be implemented thoughtfully, with clear governance to ensure it is used safely and effectively.
Data Privacy: The dashboard must respect data privacy regulations and internal policies. Use role-based access controls to ensure that users can only see the data relevant to their job function. For instance, an HR support dashboard containing sensitive employee information should be accessible only to authorized HR personnel. Any AI models trained on this data must be secured and audited to prevent data leakage.
Human in the Loop: AI should be used to augment your team, not replace its judgment. For critical decisions, such as closing a high-impact ticket or changing the priority of a major incident, a human must provide the final approval. The dashboard should present AI-driven recommendations and insights, but the ultimate accountability remains with your team.
Model Transparency: If an AI model automatically categorizes a ticket as “Urgent – System Outage,” the dashboard should ideally provide a simple explanation for its reasoning (e.g., “Keywords detected: ‘system down,’ ‘cannot log in,’ ‘outage'”). This transparency builds trust with users and allows them to quickly validate the AI’s conclusions.
Access Control: A robust access control model is non-negotiable. The needs of a front-line agent, a team manager, and a department VP are all different. Implement granular permissions that control not only who can see the dashboard but also what data and what level of detail they can access within it.
Your Next Steps to Gaining Control
A support triage dashboard is more than a reporting tool. It is an operational command center that empowers your teams to work smarter, not just harder. It replaces ambiguity with clarity and transforms a reactive support function into a proactive, data-driven business partner. The path to achieving this doesn’t have to be a massive, multi-year project.
First, conduct a simple audit of your current support process for one key team. Where are the most significant blind spots? Do you know your true backlog? Are you constantly surprised by SLA breaches? Documenting these pain points builds the business case for change.
Next, identify a single, high-impact area to target for a pilot project. Perhaps it’s managing IT support for a critical finance application during month-end close or handling HR queries during the annual performance review cycle. A focused pilot demonstrates value quickly and builds momentum.
Finally, begin the conversation with your technology and operations partners about data consolidation. The journey to operational clarity starts with connecting your disparate systems to create a single, unified view. By taking these deliberate steps, you can move your support teams out of the daily firefighting and into a position of strategic control.
Your Next Read:
Get a FREE
Proof of Concept
& Consultation
No Cost, No Commitment!