Every support leader knows the feeling. The ticket queue is a relentless, rising tide. Behind each ticket is a customer or an employee waiting for a resolution, and the cost of delay is measured in frustration, churn, and lost productivity. The traditional approach of tackling tickets in a first-in, first-out (FIFO) order is no longer sufficient. It’s a reactive strategy in a world that demands proactive service. You’re flying blind, unable to see the recurring problems, the looming deadlines, or the true health of your backlog.
The solution isn’t just to work faster; it’s to work smarter. This requires a shift from simply managing a queue to gaining intelligence about it. A modern support triage dashboard moves beyond basic ticket counts to provide a consolidated, real-time view of three critical pillars: the health of your backlog, the risk to your Service Level Agreements (SLAs), and the top issues driving volume. This intelligence empowers you to make strategic decisions that improve speed, reduce costs, and transform your support function from a reactive cost center into a proactive source of business insight.
Beyond the Ticket Count: What a Triage Dashboard Really Is
A support triage dashboard is not just another report or a prettier view of your ticketing system. It’s an analytical engine that sits on top of your support channels, ingesting raw data and transforming it into an actionable command center. While a traditional ticket queue is a chronological list, a triage dashboard is a dynamic, multi-dimensional view that answers strategic questions.
Let’s contrast the two approaches:
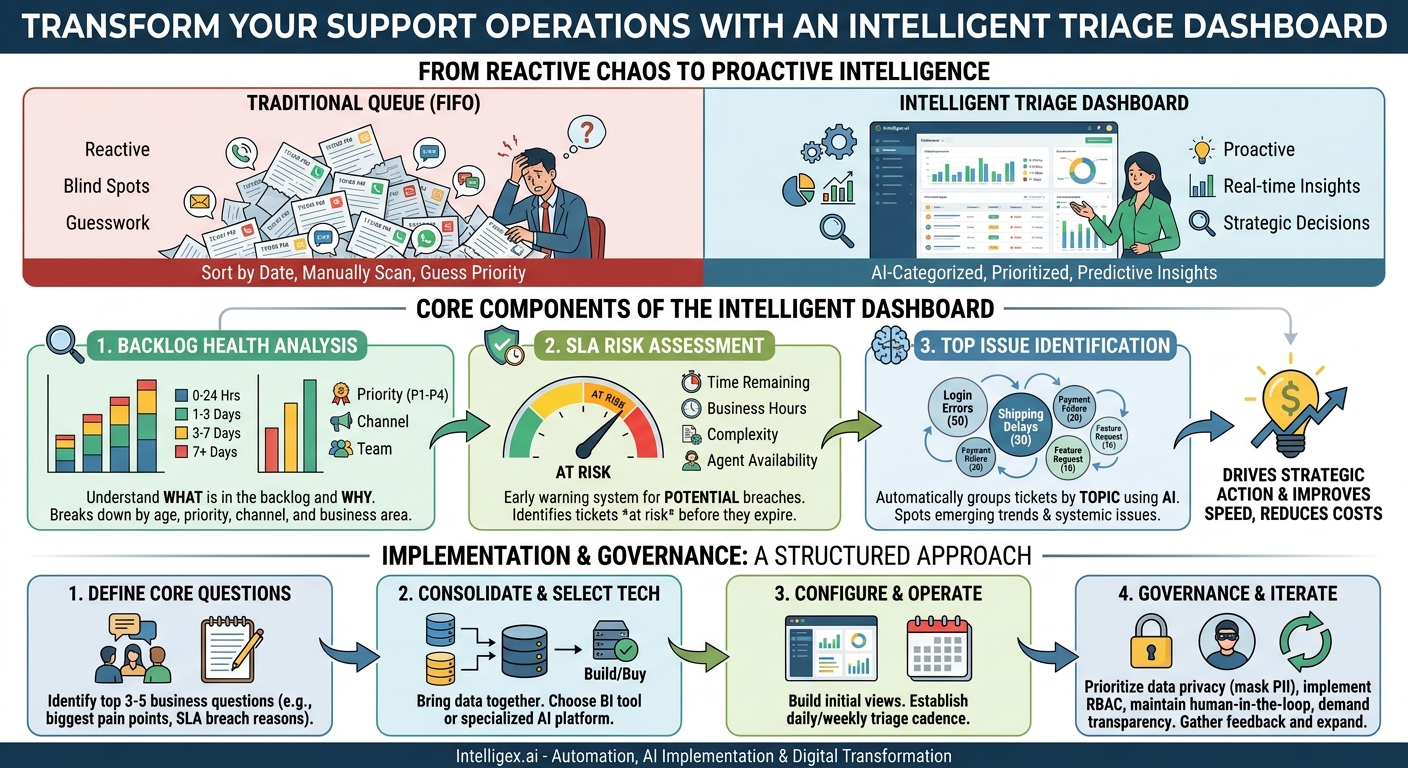
- A Traditional Queue View shows you a list of tickets, often sorted by creation date or last update. It forces agents and managers to manually scan, read, and guess which issues are most important. It’s inherently reactive, focused on what has already happened.
- An Intelligent Triage Dashboard automatically categorizes, prioritizes, and analyzes the entire ticket population in real time. It’s proactive, designed to surface insights and predict future problems.
This intelligence is built on three core components that work together:
- Backlog Health Analysis: This goes far beyond a single number of “open tickets.” It breaks down the backlog by age, priority, channel, and business area. It tells you what is in your backlog and why it’s there.
- SLA Risk Assessment: Instead of simply flagging a ticket when it has already breached its SLA, this component identifies tickets that are at risk of breaching. It acts as an early warning system, giving you time to intervene.
- Top Issue Identification: Using text analytics and clustering, this component automatically groups tickets by their underlying topic. It spots emerging trends, such as a spike in “login errors” or “shipping delays,” long before a human could manually detect the pattern.
By integrating these three views, the dashboard provides a holistic picture. You can see not only that the backlog is growing, but that it’s growing because of a specific, new issue that is putting a particular set of high-priority customer SLAs at risk. This is the difference between data and intelligence.
Deconstructing the Backlog: From Raw Numbers to Actionable Insights
The single metric of “total open tickets” is one of the most misleading in operations. A backlog of 500 tickets could be healthy if they are all low-priority and new, or it could be a crisis if 100 of them are high-priority and over a week old. To understand your backlog, you must dissect it.
A proper backlog health dashboard visualizes the data in ways that immediately highlight problems. It shifts the focus from “how many” to “what, why, and how old.”
Key Metrics to Measure Backlog Health
Instead of a simple count, your dashboard should track these more meaningful metrics:
- Backlog by Age (Ticket Aging): This is the most critical view. Group tickets into aging buckets (e.g., 0-24 hours, 1-3 days, 3-7 days, 7+ days). A large number of tickets in the “7+ days” category indicates a systemic problem with capacity, complexity, or routing.
- Backlog by Channel: Are tickets piling up from email, your web portal, chat, or phone calls? A sudden spike in the email channel might suggest an issue with a recent marketing blast or a system-generated alert storm.
- Backlog by Priority: How many of your open tickets are P1 (Critical) versus P4 (Low)? If your low-priority backlog is shrinking but your high-priority one is growing, your team is busy but focused on the wrong things.
- Backlog by Team or Category: Which part of the business is generating the most support load? For an internal IT help desk, this could be “Hardware Requests” vs. “Software Access.” For a customer-facing team, it could be “Billing Inquiries” vs. “Technical Bugs.”
Putting Backlog Insights into Action
This visibility directly drives better operational decisions. Consider these scenarios:
- Finance Team: The dashboard shows a growing backlog of “Invoice Dispute” tickets, with most of them over five days old. This isn’t just a support problem; it’s a cash flow problem. The Finance Director can use this data to investigate the root cause, whether it’s a confusing new invoice format or a bug in the billing system.
- HR Operations: The HR support backlog shows a spike in tickets categorized as “Benefits Enrollment.” The dashboard reveals they are all coming from a recently acquired company. This insight allows HR to create targeted communications and training for that specific employee group, reducing the ticket volume at its source.
- Supply Chain: A sudden increase in “Where is my order?” tickets, aged 1-3 days, is isolated to a specific distribution center. The logistics team can be alerted to a potential shipping delay at that location and proactively communicate with affected customers before they even create a ticket.
Proactive SLA Management: Moving from Red Alerts to Early Warnings
Service Level Agreements are promises to your customers or internal stakeholders. Breaking them damages trust, can have financial penalties, and indicates operational failure. Most support systems only tell you about an SLA breach after it has happened. The ticket turns red, an alarm bell rings, but it’s already too late. A proactive triage dashboard changes the game by creating an “SLA risk” category.
This isn’t just a timer. An intelligent risk model considers multiple factors:
- Time Remaining: The absolute time left before the SLA expires.
- Business Hours: It understands that 8 hours left on an SLA is very different at 9 AM Monday than at 4 PM Friday.
- Agent Availability: It can factor in the availability of agents with the right skills to solve that specific type of ticket.
–Ticket Complexity: It can learn the average handle time for different ticket types. A “password reset” might take 5 minutes, while a “server configuration” request takes 4 hours.
By combining these factors, the dashboard can flag a ticket as “At Risk” long before it’s in danger of breaching. For example, a high-priority ticket with 6 hours left on its SLA might be flagged immediately if the only qualified engineer to handle it is currently assigned to another critical issue. This gives a manager the opportunity to re-prioritize work, reassign the ticket, or manage the customer’s expectations.
What to Measure for SLA Performance
- SLA Attainment Rate: The percentage of tickets resolved within their target time. This is your historical, lagging indicator.
- At-Risk Ticket Count: The number of open tickets currently flagged as being at risk of a breach. This is your real-time, leading indicator.
- Breach by Category: When breaches do occur, what was the root cause? Was it due to “awaiting customer response,” “awaiting engineering,” or “agent capacity”? This helps you fix the process, not just blame the outcome.
- Time to First Response: A critical SLA for customer satisfaction. The dashboard can monitor this separately from the resolution SLA.
This proactive approach provides the visibility needed to manage resources effectively. It ensures that your most important commitments are met, protecting revenue and preserving customer trust.
Uncovering “Top Issues”: Your Real-Time Voice of the Customer
Your support tickets are one of the most valuable sources of business intelligence you have. They are the unfiltered voice of your customers and employees, telling you exactly what is confusing, broken, or frustrating. The challenge is that this intelligence is buried in thousands of unstructured text entries. Manually reading and tagging every ticket is impossible at scale.
This is where AI, specifically natural language processing (NLP), provides immense value. A triage dashboard can use AI models to read, understand, and automatically cluster tickets by their semantic meaning. It doesn’t just look for keywords; it understands intent.
For example, it can group these three different ticket subjects into a single topic called “Login Issues”:
- “I can’t sign in”
- “My password isn’t working”
- “Forgot my username”
By constantly analyzing the firehose of incoming tickets, this system acts as a real-time trend detector for your entire business. A sudden spike in a specific cluster is a clear signal that something has changed.
Business Scenarios Driven by Topic Clustering
- IT Operations: A new software patch is deployed overnight. By 9:15 AM, the dashboard shows a rapidly growing cluster of tickets with themes of “slow performance” and “application crash,” all mentioning the updated software. The IT team can immediately trigger a rollback procedure, preventing a full day of lost productivity for the entire company.
- Marketing Team: A new promotional campaign is launched. The dashboard identifies a new topic cluster around “promo code invalid.” The marketing team sees this within the first hour of the campaign, finds a typo in the code on the website, and fixes it. Without this, they would have wasted ad spend and frustrated thousands of potential customers.
- Sales Operations: A cluster of tickets emerges related to “quote generation error” in the company’s CRM, like Salesforce. This is a direct blocker to revenue. The dashboard alert allows the CRM admin team to investigate and resolve the bug before the sales team’s entire day is disrupted.
This automated issue detection connects the support function directly to the strategic operations of the business. It allows the organization to find and fix problems at their source, which not only reduces ticket volume but also improves the underlying customer or employee experience.
Implementing Your Triage Dashboard: A Step-by-Step Guide
Building an intelligent triage dashboard is an achievable project, but it requires a structured approach. Simply buying a tool without a plan will not lead to success. Follow these steps to ensure you create a system that delivers lasting value.
- Define Your Core Business Questions. Before you look at any technology, gather your stakeholders (support managers, operations leaders, product owners) and define what you need to know. Don’t start with “we need a dashboard.” Start with questions like, “Which product is driving the most urgent tickets?” or “What is the primary reason we miss SLAs for our enterprise customers?” Limit yourself to the top 3-5 questions to begin with.
- Consolidate Your Data Sources. Identify where your support conversations live. Is everything neatly in one system like Zendesk or ServiceNow? Or is it spread across a primary ticketing system, a separate email inbox for VIPs, and a Jira board for engineering escalations? You must have a plan to bring this data together into a single place for analysis. Start with the most critical source first.
- Select the Right Technology. You have two primary paths: build or buy.
- Build: Using a business intelligence (BI) tool like Power BI or Tableau on top of a data warehouse (e.g., Snowflake, BigQuery). This approach offers maximum customization but requires significant data engineering expertise and a longer time to implement.
- Buy: Using a specialized AI-powered support analytics platform. These solutions are pre-built for this use case, offering faster time-to-value for features like NLP-based topic clustering and SLA risk prediction.
- Configure Your Initial Views. Using the business questions from Step 1, build the first version of your dashboard. Create the backlog aging chart, the SLA risk queue, and the top issues list. Keep it simple. Use clear labels and avoid clutter. The goal is clarity, not complexity.
- Develop a Triage Cadence. A dashboard is useless if it doesn’t drive action. Institute a daily or weekly “triage meeting.” This is a short, 15-minute stand-up where key stakeholders review the dashboard, identify the most pressing items (e.g., a new top issue, a spike in aging tickets), and assign clear action items. This operational rhythm is what turns data into results.
- Iterate and Expand. After a few weeks of using the dashboard, you will learn what is most valuable and what is just noise. Gather feedback from the team. Are the topic clusters accurate? Are the SLA risk alerts useful? Use this feedback to refine the views, adjust the thresholds, and slowly expand the dashboard to answer new business questions.
Governance and Safe AI Implementation
When you start using AI to analyze customer and employee communications, you take on a responsibility to handle that data securely and ethically. Building trust in the system, both internally and externally, is critical for adoption and long-term success. A focus on governance is not optional.
As you plan your implementation, keep these principles in mind.
A Checklist for Safe AI in Support
- Prioritize Data Privacy. Support tickets can contain sensitive information. Your system must have a process for masking or anonymizing personally identifiable information (PII) before it is analyzed, especially if you are using cloud-based AI services. This includes names, email addresses, phone numbers, and financial details.
- Implement Role-Based Access Control (RBAC). Not everyone in the company should see every support ticket. An HR support agent should not be able to view customer financial data, and a product manager should not see sensitive employee relations cases. Configure access rules so that users can only see the data relevant and appropriate for their roles.
- Maintain a Human in the Loop. AI models are powerful, but they are not infallible. The AI can suggest a priority, categorize a ticket, or identify a trend, but a human expert should always have the ability to review and override the machine’s decision. The goal is AI-assisted intelligence, not complete automation without oversight.
- Demand Model Transparency. When the dashboard clusters 50 tickets into a “Payment Failure” topic, it should be able to explain why. Good systems show the common keywords and phrases that led to that grouping. This “explainability” is crucial for building trust and allowing your team to validate the AI’s findings.
Embedding these practices into your project from day one will help you harness the power of AI while mitigating risks and ensuring the system is used responsibly.
Getting Started: Your First Steps to Triage Intelligence
Transforming your support operations from a reactive queue to an intelligent, proactive function is a journey. You don’t need to boil the ocean to begin. The key is to start small, demonstrate value quickly, and build momentum. Here is a simple, actionable plan to get started.
1. Conduct a One-Week Manual Audit. Before you build anything, create a simple baseline. For one business week, have your team leads manually track two things: the primary reason for every SLA breach and the topic of every tenth ticket. This small data set will be imperfect, but it will give you a powerful snapshot of your biggest pain points and help you build the business case for a more automated solution.
2. Identify Your Primary Data Source. Where does the bulk of your most important support data live? Is it your CRM? Your IT Service Management tool? Focus your initial efforts on this single source of truth. Proving value with one well-integrated data source is far more effective than trying to connect five disparate systems at once.
3. Launch a Focused Pilot Program. Select a single team or a single product line for your first triage dashboard. The goal is to create a tangible success story. By focusing on a specific area, you can configure the dashboard to their exact needs, train them effectively, and clearly measure the impact on their key metrics, such as resolution time or SLA attainment.
This disciplined approach allows you to learn, iterate, and build confidence. By moving from manual guesswork to data-driven triage, you equip your teams with the visibility they need to not only resolve issues faster but also to help the entire organization build better products and deliver better service.
Related Posts
Get a FREE
Proof of Concept
& Consultation
No Cost, No Commitment!