If your organization runs on spreadsheets, you’re not alone. They are the go-to tool for everything from sales tracking to financial forecasting. But as your business grows, the spreadsheet-driven approach begins to show its cracks. You start hearing familiar refrains in meetings: “Which version of the file is this?” or “My numbers don’t match yours.” Decisions slow down, teams spend more time arguing about data than acting on it, and costly mistakes become more frequent.
This is not a technology problem at its core. It is a maturity problem. Moving beyond this spreadsheet chaos toward a system of trusted, accessible metrics is the essence of building data maturity. It’s a journey that transforms data from a source of confusion into a strategic asset that fuels growth, efficiency, and competitive advantage. The goal isn’t just to have better reports. It’s to build a resilient organization that can adapt and thrive by making smarter, faster decisions at every level.
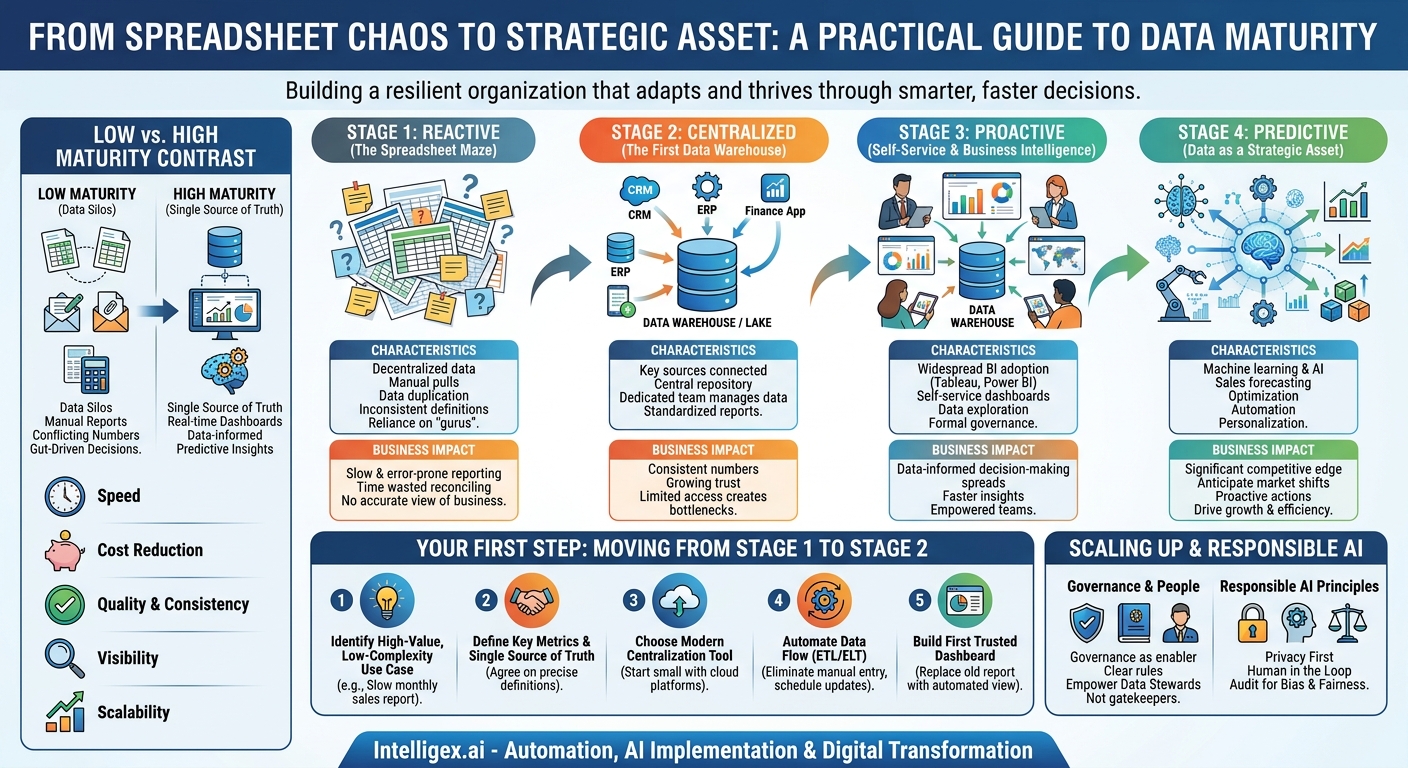
What “Data Maturity” Actually Means for Your Business
Data maturity isn’t about accumulating the most data or buying the most expensive software. It is a measure of how effectively your organization uses data to achieve its goals. It reflects your capabilities across people, processes, and technology, turning raw information into actionable insight.
Think about the contrast between low and high maturity:
- A low-maturity organization operates in data silos. The marketing team has its customer list in one system, the sales team has a different version in the CRM, and finance tracks revenue in yet another. Reports are built manually, are often out of date by the time they are presented, and rarely agree with each other. Business decisions are heavily reliant on gut instinct and personal experience.
- A high-maturity organization operates from a single source of truth. Teams across the company work from the same trusted datasets and definitions. Dashboards update in near real-time, providing a clear view of business performance. Decisions are data-informed, and teams can shift from just reporting on what happened to predicting what will happen next.
Achieving this maturity delivers tangible business value across several key areas:
- Speed: When data is trusted and accessible, you no longer wait days or weeks for a report. Answers to critical business questions are available on demand, accelerating decision-making cycles from strategic planning to daily operations.
- Cost Reduction: Automating data collection and reporting frees up countless hours of manual work. Your highly skilled employees can stop copy-pasting data into spreadsheets and focus on high-value analysis and strategy.
- Quality and Consistency: A centralized, governed approach eliminates conflicting numbers and reduces the risk of human error. This builds trust in the data and ensures everyone is working with the same facts.
- Visibility: With a unified view of operations, leadership can spot trends, identify risks, and uncover opportunities that were previously hidden in disconnected data silos.
- Scalability: A mature data infrastructure can handle growing volumes of data without buckling. It provides a solid foundation for more advanced analytics, machine learning, and AI applications that drive future growth.
The Four Stages of Data Maturity: A Practical Framework
Understanding where you are is the first step toward improvement. While every organization is different, most follow a similar path. We can break this journey down into four practical stages.
Stage 1: Reactive (The Spreadsheet Maze)
This is the starting point for many businesses. Data is decentralized and lives in individual spreadsheets, department-specific applications, and email attachments. There is no single source of truth.
- Characteristics: Highly manual data pulls, rampant data duplication, inconsistent metric definitions (e.g., Sales and Finance define “customer” differently), and a heavy reliance on a few “spreadsheet gurus.”
- Business Impact: Reporting is slow and error-prone. Teams waste significant time reconciling data instead of analyzing it. It’s nearly impossible to get a complete, accurate view of the business.
Stage 2: Centralized (The First Data Warehouse)
In this stage, the organization recognizes the pain of data silos and takes the first step to consolidate information. This often involves building a central data repository, like a data warehouse or a data lake.
- Characteristics: Key data sources (like the CRM and ERP) are connected to a central database. A dedicated team (often in IT) manages the data and builds standardized reports. Reporting becomes more consistent.
- Business Impact: For the first time, different departments can see the same numbers for key metrics like revenue or customer count. Trust in data begins to grow, but access is often limited, creating a bottleneck for new requests.
Stage 3: Proactive (Self-Service and Business Intelligence)
The focus shifts from centralized reporting to democratized access. The organization invests in modern business intelligence (BI) tools that allow business users to explore data and create their own analyses without needing to file a ticket with IT.
- Characteristics: Widespread adoption of BI tools like Tableau or Microsoft Power BI. Teams can build their own dashboards and dig into the “why” behind the numbers. Data governance becomes more formal to ensure quality and security.
- Business Impact: Data-informed decision-making spreads throughout the organization. Teams are empowered to answer their own questions, leading to faster insights and better departmental performance.
Stage 4: Predictive (Data as a Strategic Asset)
At the highest level of maturity, data is fully integrated into the strategic fabric of the company. The organization moves beyond historical reporting to use data for prediction, optimization, and automation.
- Characteristics: Use of machine learning and AI to forecast sales, predict customer churn, optimize supply chain logistics, and personalize marketing campaigns. Data is a core component of new products and services.
- Business Impact: The organization gains a significant competitive edge. It can anticipate market shifts, proactively address customer needs, and automate complex operational processes, driving both top-line growth and bottom-line efficiency.
Your First Step: A Quick Assessment of Your Current State
Before you can plan your journey, you need to know your starting point. Be honest and answer these questions about your organization’s current relationship with data. This isn’t a test, but a tool to identify your biggest areas of opportunity.
- Timeliness: When a leader asks for a new business report (e.g., “What was our customer acquisition cost by channel last quarter?”), does the answer take hours, days, or weeks to produce?
- Consistency: If your Head of Sales and your CFO both present a report on quarterly revenue, how likely are their numbers to match perfectly?
- Trust: Do your teams spend more time in meetings questioning the data’s validity (“Where did you get this number?”) or discussing its implications (“What should we do based on this trend?”)?
- Focus: Is 90% of your data effort focused on reporting what has already happened, or are you starting to use data to forecast what might happen next?
- Automation: How much of your reporting process involves someone manually exporting data from one system and copy-pasting it into a spreadsheet for analysis?
– Accessibility: Is data exploration limited to a small group of analysts and IT staff, or can a manager in Operations or HR access the data they need to do their job effectively?
Your answers will likely place you squarely in one of the stages described above. If you find yourself in the “Reactive” or early “Centralized” stage, you are in the right place to take the most impactful next steps.
Moving from Stage 1 to Stage 2: Escaping the Spreadsheet Maze
The leap from a chaotic, spreadsheet-driven environment to a centralized, trusted data source is often the most challenging, yet most rewarding, step in the maturity journey. The key is to avoid trying to fix everything at once. Instead, focus on a single, high-impact project to build momentum and demonstrate value. Here is a step-by-step process to guide you.
- Identify a High-Value, Low-Complexity Use Case. Don’t start by trying to build a massive, all-encompassing enterprise data warehouse. Look for a specific, painful problem. For example, the executive team might be frustrated by the three-week delay in getting a consolidated sales performance report after the end of each month. This is a perfect starting point.
- Define Key Metrics and Their Single Source of Truth. Get the key stakeholders (e.g., from Sales, Finance, and Operations) in a room. The goal is to agree on precise definitions for the metrics in your chosen use case. For a sales report, this might include:
- What constitutes a “Lead”? Is it when a form is filled out on the website (Marketing’s system) or when a salesperson qualifies it in the CRM (Sales’ system)?
- When is a “Deal Closed-Won”? Is it when the contract is signed (tracked in Salesforce) or when the first invoice is paid (tracked in the accounting system)?
Agreeing on these definitions and identifying the primary system for each is a critical foundation for trust.
- Choose a Modern Centralization Tool. The days of multi-year, multi-million dollar data warehouse projects are over. Modern cloud platforms allow you to start small and scale as you grow. A solution could be a cloud data warehouse like Snowflake or Google BigQuery. These platforms are designed to handle data from various sources and separate storage from computing costs, making them flexible and cost-effective.
- Automate the Data Flow (ETL/ELT). The magic happens when you eliminate manual data entry. Use an Extract, Load, Transform (ELT) tool to automatically pull data from your source systems (like your CRM, ad platforms, and financial software) and load it into your new central repository. This process can be scheduled to run daily or even hourly, ensuring your data is always up to date.
- Build the First Trusted Dashboard. Connect a BI tool to your new centralized data source and build an automated, interactive dashboard that replaces the old, manual spreadsheet report. When you present this to your stakeholders, they will see a single, trusted view of their performance that is always current. This quick win is the most powerful way to secure buy-in for further investment in your data maturity.
Scaling Up: The Critical Role of Governance and People
Technology is only one piece of the puzzle. As you move toward self-service analytics and more advanced uses of data, the human element becomes paramount. Without clear rules and empowered people, even the best technology can lead to chaos.
Data Governance is Not a Bureaucratic Hurdle
Many people hear “governance” and think of restrictive rules and red tape. In reality, good data governance is an enabler of speed and trust. It’s about creating clear, shared rules of the road for your company’s data. Practical governance answers questions like:
- Access Control: Who is allowed to see sensitive financial or HR data? How is access requested and approved?
- Metric Definitions: Where is the official, company-wide definition of “Customer Lifetime Value” or “Employee Turnover Rate” documented?
- Data Quality: What are the procedures for identifying and correcting data errors at the source?
Start small. Don’t try to write a 100-page policy document. Begin by creating a simple, shared glossary of your top 20 business metrics and designating their official owners.
Empower Data Stewards, Not Gatekeepers
A successful data culture relies on “Data Stewards.” These are not technical roles. A data steward is a subject matter expert from a business unit, like a senior financial analyst or a marketing operations manager. They are responsible for the quality, definition, and business logic of the data within their domain. They don’t hoard the data; they act as champions for its correct and effective use, helping their colleagues understand and apply it properly.
A Note on AI and Responsible Implementation
As you progress to the higher stages of maturity, you will inevitably explore using AI and machine learning to create predictive insights. This step unlocks tremendous value but also introduces new responsibilities. Implementing these advanced technologies safely and ethically is non-negotiable.
Keep these principles in mind:
- Privacy and Security First: Ensure that any personally identifiable information (PII) or other sensitive data is handled with extreme care. Use techniques like data anonymization and enforce strict, role-based access controls so that people can only see the data they absolutely need to perform their jobs.
- Maintain a Human in the Loop: For high-stakes decisions, AI should serve as a co-pilot, not an autopilot. An algorithm might recommend which sales leads to prioritize or identify an anomalous financial transaction, but a human expert should always have the ability to review the recommendation and make the final call.
- Audit for Bias and Fairness: AI models learn from historical data. If that data contains past biases (for example, in hiring practices), the model will learn and potentially amplify them. It is crucial to regularly audit your models to ensure they are performing fairly and equitably across different groups.
What’s Next? Your Action Plan
Embarking on a data maturity journey can feel daunting, but progress is made through a series of small, deliberate steps. You don’t need a massive budget or a huge team to get started. You need focus and a commitment to continuous improvement. Here is how you can begin today.
- Assess Your Stage: Use the simple checklist in this post to have an honest conversation with your team about where you are today. Identifying your current stage provides clarity on your most immediate challenges.
- Pick One Painful Problem: Find the one manual report that causes the most frustration, takes the most time, or leads to the most arguments. Make fixing this your singular focus for the next 90 days.
- Unify the Definitions: Get the three to five key stakeholders for that single report into a room. Your only goal is to leave with an agreed-upon, written-down definition for each metric and its official data source.
- Start Small, Prove Value: Use your first project to prove the value of a more mature approach. A single automated dashboard that saves 20 hours of manual work per month and eliminates data conflicts is more powerful than a hundred-slide strategy presentation.
Building data maturity is a journey, not a destination. By starting small, focusing on business value, and bringing your people along with you, you can successfully move from the chaos of spreadsheets to a culture of trusted metrics that drives your business forward.
Your Next Read:
Category:
Get a FREE
Proof of Concept
& Consultation
No Cost, No Commitment!