If your team runs on spreadsheets, you know the daily routine. It’s a delicate dance of copying, pasting, and manually updating files with names like Q3_Forecast_v4_final_final.xlsx. Every critical report is a monumental effort, and by the time it’s ready, the data is already stale. You spend more time wrangling information than using it, and when two departments present conflicting numbers, no one knows which version of the truth to believe.
This isn’t just an IT problem. It’s a business bottleneck that costs you speed, money, and opportunity. The solution isn’t another spreadsheet template or a stricter file naming convention. It’s about increasing your organization’s data maturity, a journey that transforms raw data from a source of friction into your most reliable strategic asset.
What is Data Maturity (And Why Should You Care)?
Data maturity isn’t about buying expensive software or hiring a team of data scientists overnight. It’s the measure of how well your organization’s people, processes, and technology work together to turn data into reliable answers and intelligent actions. It’s the difference between guessing and knowing.
An organization with low data maturity is reactive. Data is trapped in disconnected spreadsheets and software silos. Teams operate on gut feel and anecdotal evidence because getting real answers is too slow and difficult. In contrast, a high-maturity organization is proactive. Data is centralized, trusted, and accessible, empowering teams to make confident decisions that drive growth.
Investing in data maturity delivers clear business value across the board:
- Speed: Get answers to critical business questions in minutes, not weeks. Your teams can react to market changes, customer feedback, and operational issues faster than the competition.
- Cost Reduction: Automating manual data collection and reporting frees up hundreds of hours of valuable employee time. This also reduces the high cost of mistakes caused by human error.
- Quality and Trust: When everyone works from a single source of truth, you eliminate conflicting reports and endless debates about whose numbers are correct. Decisions become fact-based and consistent.
- Visibility: Gain a clear, unified view of your entire operation. Leaders can see how performance in one area, like marketing campaigns, impacts another, like supply chain demand, and make holistic decisions.
- Scalability: Spreadsheets break under pressure. A mature data infrastructure is built to grow with your business, handling more data from more sources without collapsing.
Diagnosing Your Current State: The Spreadsheet Symptom
Before you can chart a path forward, you need to know where you stand. Most organizations struggling with low data maturity exhibit a few common symptoms. See how many of these sound familiar:
- The “Master” Spreadsheet: A single, monstrously complex spreadsheet runs a critical business function like financial forecasting, project management, or sales commissioning. It’s fragile, slow, and usually only one person truly understands how it works.
- Version Control Chaos: Your shared drive is a graveyard of file names like Report_v2_final, Report_v3_JJS_edits, and Report_v3_FINAL_use_this_one. No one is ever 100% sure they are looking at the latest version.
- The Monthly Reporting Fire Drill: The first week of every month is a scramble. Your team spends days manually pulling data from ten different sources, cleaning it up, and pasting it into a presentation deck. There is little to no time left for actual analysis.
- Conflicting Metrics: Your sales team reports achieving 110% of their quarterly goal, but the finance team’s revenue report shows they are at 95%. Both teams pull from their own systems, and the resulting debate wastes time and erodes trust.
- “Data Gatekeepers”: Access to information is bottlenecked. If you need a specific report, you have to ask a specific person who then runs a manual export. You can’t explore the data yourself.
A classic example is a supply chain manager trying to forecast inventory. They receive a sales forecast spreadsheet from the sales team, a shipping report from the logistics partner, and a production schedule from the factory. Each file uses slightly different product names or codes. The manager spends a full day manually reconciling the three documents just to place new orders. This manual friction directly leads to costly overstocking or customer-disappointing stockouts.
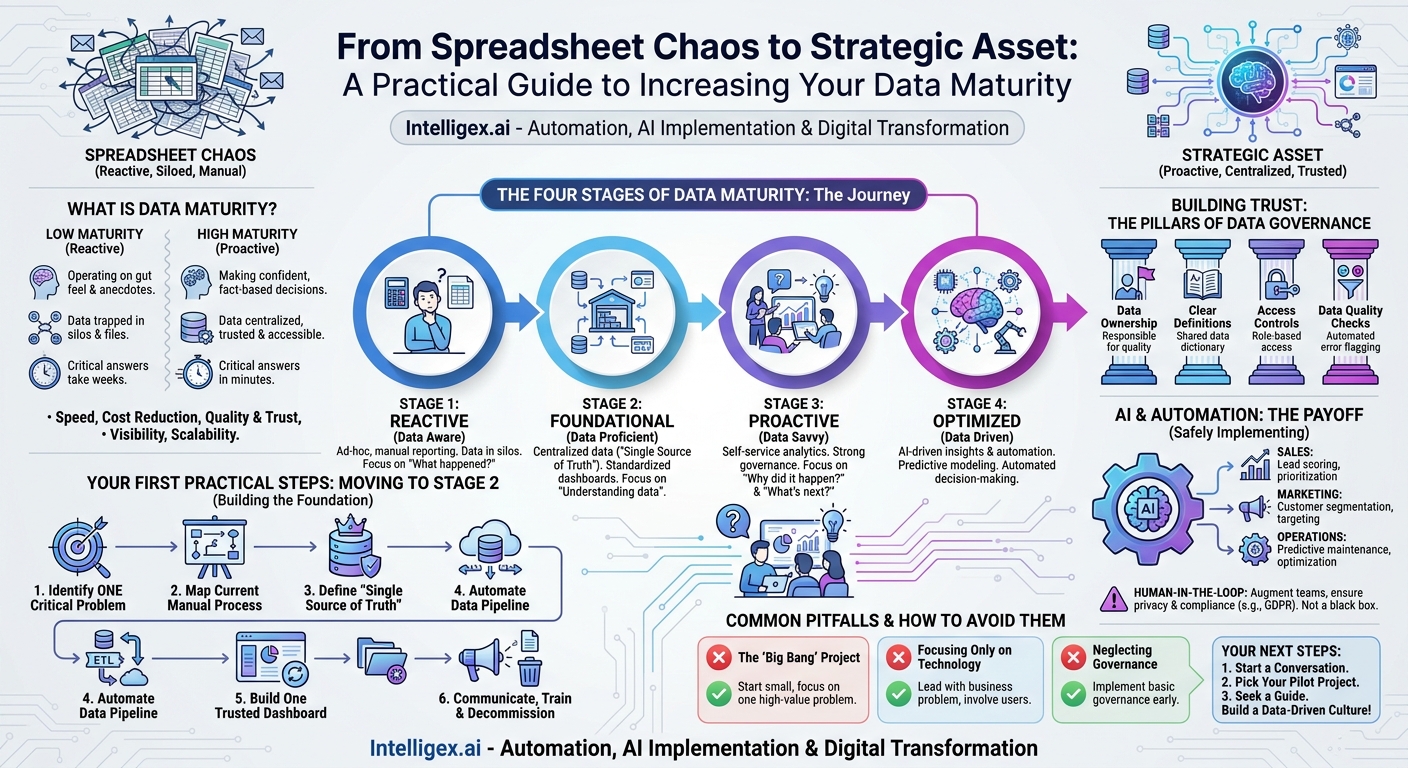
The Four Stages of Data Maturity
The journey from spreadsheet chaos to trusted metrics is an evolution. We can break it down into four distinct, achievable stages. Understanding these stages helps you set realistic goals and measure your progress.
Stage 1: Reactive (Data Aware)
At this stage, your organization acknowledges the importance of data, but it remains trapped in silos. Spreadsheets, local databases, and individual software platforms are the primary containers for information. Reporting is a manual, ad-hoc process performed by a few key people. The primary focus is simply trying to figure out what happened last month.
Stage 2: Foundational (Data Proficient)
Organizations here have taken the first crucial step: centralizing data. They have established a “single source of truth,” often a cloud data warehouse, where data from key systems is collected. Standardized dashboards, built with tools like Power BI or Tableau, begin to replace spreadsheets for recurring reports. The conversation shifts from finding the data to understanding it.
Stage 3: Proactive (Data Savvy)
Data is now widely trusted and accessible across the organization. With strong data governance in place, business teams are empowered with self-service analytics tools. They can ask and answer their own questions, moving beyond “what happened?” to explore “why did it happen?” and “what is likely to happen next?” Data is used to optimize processes and anticipate business needs.
Stage 4: Optimized (Data Driven)
In the most mature organizations, data and AI are woven into the fabric of daily operations. Insights are delivered automatically to the right people at the right time. Predictive models help forecast demand, identify at-risk customers, and optimize pricing. Data isn’t just used to report on the business; it actively helps run the business through automated decision-making and intelligent workflows.
Your First Practical Steps: Moving to Stage 2
Trying to jump from Stage 1 to Stage 4 is a recipe for failure. The most important move is building a solid foundation to get to Stage 2. This involves replacing your most painful manual process with an automated, trustworthy alternative. Don’t try to boil the ocean. Pick one high-value problem and solve it correctly.
Follow this step-by-step process:
- Identify One Critical Business Problem. Start with a process that is both highly painful and highly valuable. A great candidate is a report that is manually created every week or month, is used by leadership to make decisions, and is notorious for errors. For example, the weekly sales pipeline and forecast report.
- Map the Current Manual Process. Before you automate, you must understand. Whiteboard the current workflow. Where does the data come from (e.g., Salesforce, a marketing platform, a finance system)? Who is responsible for pulling it? What manual steps are taken to clean, merge, and format it? This map will reveal your key pain points.
- Define the “Single Source of Truth.” For every key piece of data in your chosen report, declare one system as the definitive source. For instance, all opportunity and account data must come from your CRM (like Salesforce), and all recognized revenue data must come from your ERP. This eliminates ambiguity.
- Automate the Data Pipeline. Use a modern data integration tool (an ETL or ELT process) to automatically pull data from your source systems into a simple, centralized location, like a cloud data warehouse (e.g., Amazon Redshift, Google BigQuery, or Snowflake). This step replaces the error-prone “manual export and copy-paste” routine. You can find robust tools and services for this on cloud platforms like Amazon Web Services.
- Build One Trusted Dashboard. Using a business intelligence (BI) tool, connect to your new centralized data source and recreate the report as an interactive dashboard. This dashboard should be automatically refreshed on a schedule (e.g., every hour). It becomes the new, official home for this information.
- Communicate, Train, and Decommission. This step is critical. Announce the launch of the new dashboard. Hold a short training session to show stakeholders how to use it and explain why it is more reliable than the old spreadsheet. Finally, officially retire the old manual reporting process. Archive the spreadsheets and direct all future requests to the new dashboard.
By successfully executing this process for one report, you not only solve a real business problem but also create a blueprint you can replicate across the entire organization.
Building Trust: The Pillars of Data Governance
Technology alone does not create trust. If users don’t believe the data is accurate, they will revert to their old spreadsheets. True trust comes from data governance, which sounds intimidating but can start with a few simple, practical principles. It’s about creating clear rules of the road for your data.
Here is a basic checklist to get you started:
- Data Ownership: Is there a clear business owner for each critical data set? For example, the VP of Sales should own the sales pipeline data, and the Head of HR should own employee data. Owners are responsible for the quality and accuracy of their domain.
- Clear Definitions: Does your company have a single, agreed-upon definition for key business terms? Everyone should agree on what counts as an “Active Customer,” “Gross Margin,” or “Lead.” Document these in a simple, shared location. This is the start of your data dictionary.
- Access Controls: Who should be allowed to see and edit what data? Implement role-based access to ensure sensitive information, like employee salaries or customer PII, is protected and only accessible to authorized personnel.
- Data Quality Checks: As you automate your data pipelines, build in simple, automated checks for common errors. For example, flag records with missing email addresses, check for duplicate entries, or ensure that order dates are in a valid format.
A Note on AI and Automation: The Payoff for Maturity
Artificial intelligence and machine learning promise to revolutionize business, but they are not magic. Effective AI is built on a foundation of clean, consistent, and well-understood data. Without data maturity, any investment in AI is likely to fail.
Once you have a trusted data foundation, you can begin to explore practical AI applications that deliver real value. Think of it as the ultimate payoff for your hard work.
- Sales: A lead scoring model that predicts which prospects are most likely to buy, allowing your sales team to prioritize their time effectively. This only works if your historical lead and customer data from your CRM is accurate.
- Marketing: Customer segmentation models that identify high-value customer groups for targeted campaigns. This requires clean, integrated data from your sales, service, and marketing platforms.
- Operations: Predictive maintenance models that analyze sensor data from machinery to predict failures before they happen, reducing downtime. This relies on a consistent stream of high-quality operational data.
Implementing AI Safely
As you venture into automation and AI, it’s crucial to proceed with caution. The goal is to augment your team, not create an uncontrollable black box. Always prioritize a “human-in-the-loop” approach for critical decisions. Be transparent with your teams about how AI models are generating recommendations, and ensure that data privacy and compliance with regulations like GDPR are core principles of your design, not afterthoughts.
Common Pitfalls and How to Avoid Them
Many data initiatives stumble. By learning from common mistakes, you can significantly increase your chances of success.
Pitfall 1: The “Big Bang” Project. Trying to centralize and clean all of your company’s data at once is a massive, expensive undertaking that often fails to deliver value before it runs out of budget or momentum.
Solution: Start small. Use the six-step process outlined above to solve one specific, high-impact business problem. A quick win builds credibility and shows tangible value, making it easier to secure support for future projects.
Pitfall 2: Focusing Only on Technology. Buying the latest and greatest data platform will not magically fix your problems. If you don’t address the underlying processes and train your people, you’ll just have a new, expensive tool that nobody uses correctly.
Solution: Lead with the business problem, not the technology. Involve business users from the very beginning. Focus on changing behaviors and workflows, and choose technology that supports those new processes.
Pitfall 3: Neglecting Governance. Without clear ownership and rules, your shiny new data warehouse can quickly turn into a “data swamp,” a messy repository of untrustworthy information that is just as bad as the spreadsheet chaos you left behind.
Solution: Implement the basic governance checklist early in your journey. Assign data owners and define key metrics from day one of your pilot project. Governance is a process, not a project.
Your Next Steps: Building a Data-Driven Culture
Achieving data maturity is not a one-time project; it’s a cultural shift. It’s a commitment to replacing guesswork with evidence and empowering your teams with the information they need to do their best work. Moving from spreadsheets to trusted metrics is the first and most important step on that journey.
Here is your action plan to get started:
- Start a Conversation. Use this article as a starting point for a discussion with your team. Use the “Diagnosing Your Current State” section to identify where your biggest data-related pains are. Getting alignment on the problem is the first step toward a solution.
- Pick Your Pilot Project. Working with your team, identify the single best candidate for your first data maturity project. Which manual report, if automated and made trustworthy, would save the most time and enable better decisions?
- Seek a Guide. You don’t have to navigate this journey alone. Building a solid data foundation is a specialized skill. Whether you decide to build that capability internally or work with an experienced partner, getting expert guidance will help you avoid common pitfalls and accelerate your progress.
The path away from spreadsheet chaos is clear. By taking deliberate, practical steps to build a foundation of trusted data, you can unlock new levels of speed, efficiency, and intelligence for your entire organization.
Related Posts
Category:
Get a FREE
Proof of Concept
& Consultation
No Cost, No Commitment!