

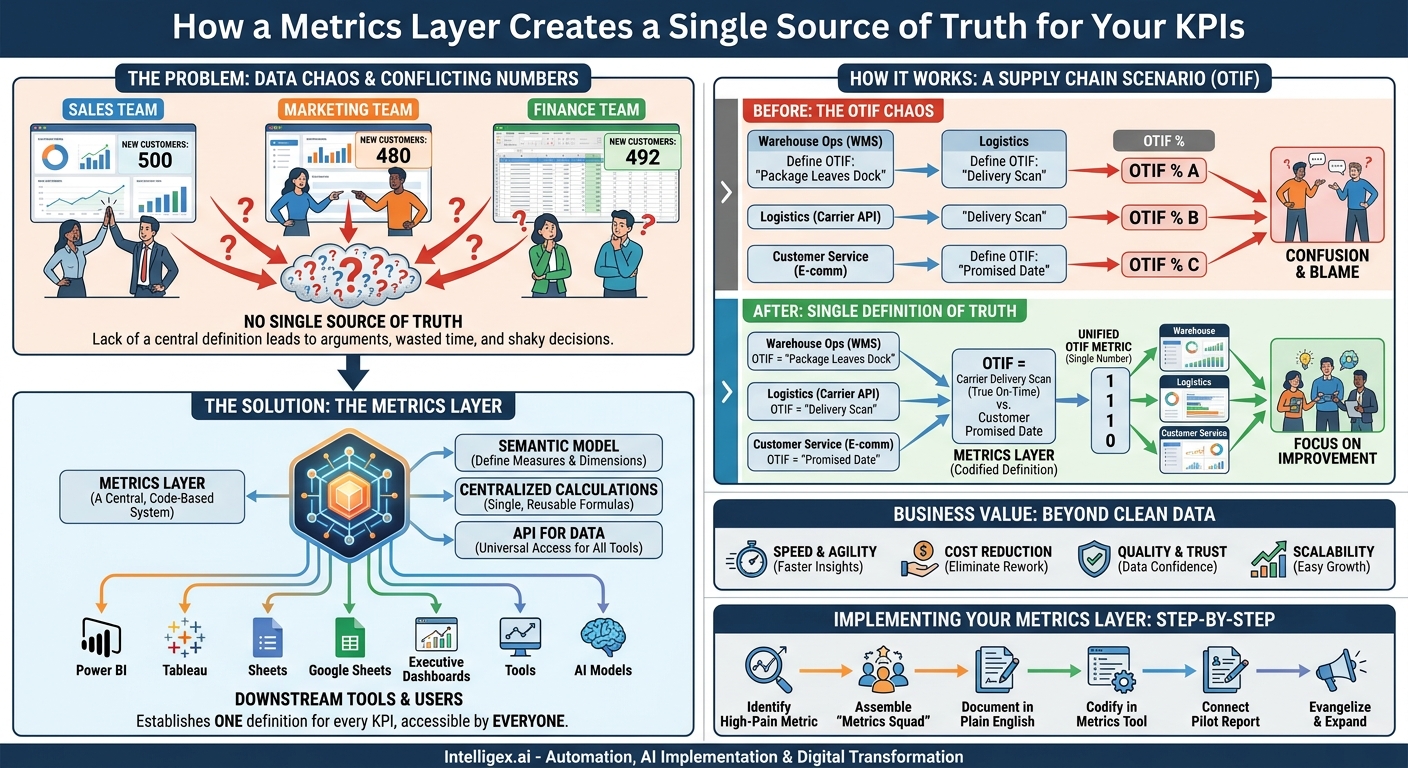
Your sales team reports 500 new customers last quarter. Marketing claims 480. Finance, looking at initial payments, says it’s 492. Who is right? This isn’t a sign of untalented teams. It’s a symptom of a common, costly problem: a lack of a single, agreed-upon definition for your most important business metrics. When every department, every dashboard, and every spreadsheet calculates Key Performance Indicators (KPIs) in its own way, you don’t get insights. You get arguments, wasted time, and decisions based on shaky data.
The solution isn’t another dashboard or a stricter policy on spreadsheets. The solution is a foundational piece of the modern data stack called a metrics layer. It’s a centralized, code-based system for defining all your business logic in one place. Think of it less as a tool and more as a constitution for your company’s data. It establishes one, and only one, definition of truth for every KPI that matters.
What Exactly Is a Metrics Layer?
At its core, a metrics layer is a translation system that sits between your raw data sources (like your data warehouse) and the tools your teams use to analyze that data (like Power BI, Tableau, or Google Sheets). Instead of having an analyst define “Monthly Recurring Revenue” (MRR) inside a specific report, that definition is coded once in the metrics layer. From that point on, every tool, team, and user who asks for MRR gets the exact same number, calculated in the exact same way.
This approach moves business logic out of fragile, siloed reports and into a central, reusable, and version-controlled environment. It is comprised of a few key ideas:
- A Semantic Model: This is where you define your business concepts. You declare your measures (the numbers you want to calculate, like Total Sales or Customer Count) and your dimensions (the attributes you want to group by, like Region, Product Category, or Time Period).
- Centralized Calculations: The formula for a metric is written once. For example, the logic for `net_revenue` (defined as `gross_revenue – refunds – discounts`) is stored in one place. Any change to this logic is instantly reflected everywhere.
- An API for Data: The metrics layer exposes these pre-defined metrics through an API. This means any tool that can make a standard data request can access these trusted numbers, ensuring consistency across the entire organization, from executive dashboards to operational AI models.
The old way was to build logic into individual assets. The new way is to build logic into a central platform that serves all assets. This shift is fundamental to building a data-driven culture that trusts its own numbers.
The Business Value: Beyond Just “Clean Data”
Implementing a metrics layer delivers tangible business value far beyond just having more accurate reports. It impacts your organization’s core ability to operate and compete.
Speed and Agility
When analysts no longer have to spend 80% of their time finding, cleaning, and validating data, they can focus on generating insights. A new request from the executive team for a “quarter-over-quarter analysis of customer acquisition cost by marketing channel” no longer takes two weeks. Because “Customer Acquisition Cost” and “Marketing Channel” are already defined, the task can often be completed in hours. This accelerates the pace of decision-making across the entire company.
Cost Reduction
Think of the hidden costs of data inconsistency. How many hours do your finance and operations teams spend every month reconciling different reports? How many data engineers are building and maintaining redundant data pipelines that essentially calculate the same things in slightly different ways? A metrics layer eliminates this duplicate work. It reduces the engineering overhead required to support analytics and minimizes the costly human effort spent arguing over which number is correct.
Quality and Trust
This is the most critical benefit. When a sales leader, a marketing manager, and a financial analyst all pull the “New Customer” metric and see the same number, trust in the data ecosystem grows exponentially. This confidence is the bedrock of a data-informed culture. Without it, data is just a collection of opinions. With it, data becomes the source of truth that powers strategic conversations and confident action.
Scalability
As your company grows, acquires new businesses, or adopts new software tools, data complexity explodes. A metrics layer provides a stable, scalable foundation. When you launch a new product line, you simply add it as a dimension. When you migrate to a new CRM, you update the data source connection in one place, and all 50 of your sales reports update automatically without breaking. This architectural stability is crucial for long-term growth.
How a Metrics Layer Works in Practice: A Supply Chain Scenario
Let’s make this concrete. Imagine a retail company struggling with its “On-Time In-Full” (OTIF) delivery metric, a critical KPI for supply chain and customer satisfaction.
The Old Way: The OTIF Chaos
Without a metrics layer, the situation is messy:
- The Warehouse Operations team calculates OTIF using data from their Warehouse Management System (WMS). They define “on-time” as the moment a package leaves their dock.
- The Logistics team calculates OTIF using data from their carrier partners’ APIs. They define “on-time” as the moment the package is delivered to the customer’s doorstep, based on the carrier’s delivery scan.
- The Customer Service team hears directly from customers and measures “on-time” based on the delivery date promised to the customer at checkout, which is stored in the e-commerce platform.
The result is three different OTIF percentages, leading to unproductive meetings where teams defend their numbers instead of solving delivery problems. The company can’t get a clear picture of its actual performance.
The New Way: A Single Definition of OTIF
With a metrics layer, the company establishes a single source of truth.
A data team works with stakeholders from Operations, Logistics, and Customer Service to create one official, codified definition of OTIF. They decide the “true” on-time event is the carrier’s final delivery scan, and the “true” due date is the one promised to the customer. The “in-full” component is validated against the original order in the e-commerce system.
This logic is coded into the metrics layer. It pulls data from the WMS, the carrier APIs, and the e-commerce platform to calculate one unified OTIF metric. Now, when any department builds a report or dashboard, they simply request the “OTIF” metric. Everyone sees the same number, and the conversation shifts from “Whose data is right?” to “How do we improve our on-time delivery performance?”
Implementing Your First Metrics Layer: A Step-by-Step Guide
Adopting a metrics layer doesn’t require a massive, multi-year overhaul. The most successful implementations start small, prove value quickly, and expand incrementally. Here’s a practical, step-by-step approach.
- Identify a High-Impact, High-Pain Metric. Don’t try to define all your company’s KPIs at once. Start with one that is both critically important and notoriously inconsistent. Good candidates are often cross-functional metrics like “Net Revenue,” “Customer Churn Rate,” or “Active User Count.” Pick the one that causes the most arguments.
- Assemble a Cross-Functional “Metrics Squad.” This is not a project for the IT department to do alone. Your first squad should include a business stakeholder who feels the pain (e.g., the VP of Marketing who can’t trust their campaign ROI), a data engineer who knows the source systems, and a data analyst who builds reports for the business.
- Document the Official Definition in Plain English. Before any code is written, the squad must agree on the business logic. Get everyone in a room and write down the definition. For “Active User,” does it mean they logged in? Or do they have to perform a key action? Is it daily, weekly, or monthly? This plain-language document is your source of truth.
- Codify the Definition in a Metrics Tool. Now, the data engineer translates the agreed-upon business logic into code using a metrics layer tool. Popular open-source and commercial frameworks that enable this include the dbt Semantic Layer (from dbt Labs) or Cube. The code should be version-controlled using a system like Git, so every change to a definition is tracked and auditable.
- Connect a Pilot Report and Validate. Plumb the newly defined metric into a single, high-visibility dashboard. Sit with the business stakeholder and validate that the numbers make sense. Compare the new, consistent metric to the old, fragmented ones to highlight the improvement.
- Evangelize the Win and Expand. Publicize your success. Show other departments how the Marketing team now has a trustworthy ROI metric that aligns with Finance. This success story creates pull from other business units, building momentum to tackle the next high-pain metric on your list.
Choosing Your Tools: Key Considerations
The technology landscape for metrics layers is evolving quickly. When evaluating tools, focus less on features and more on how they fit into your existing and future data ecosystem. Don’t get locked into a proprietary system that limits your options down the road.
Here are the key decision points to consider:
- Integration: How easily does the tool connect to your primary data warehouse (e.g., Snowflake, BigQuery, Databricks)? How well does it integrate with the BI and analytics tools your business teams already love (e.g., Tableau, Power BI, Looker, Hex)?
- Governance and Access Control: Can you define permissions at a granular level? For example, can you ensure that a sales manager can only see data for their region, or that PII (Personally Identifiable Information) is masked for all users except the HR team?
- Development Workflow: Does the tool treat metric definitions as code? Does it support version control (Git), automated testing, and CI/CD (Continuous Integration/Continuous Deployment) workflows? This is non-negotiable for maintaining quality and managing changes at scale.
- Open vs. Proprietary: Are you choosing an open framework that can serve metrics to any downstream tool (a “headless BI” approach), or a tool that is tightly coupled with a specific vendor’s visualization platform? An open approach provides more flexibility for the future.
Governance and Security: The Foundation for AI
A metrics layer is more than a convenience for BI teams; it is a critical component of a modern data governance and security strategy. By centralizing definitions, you create a powerful control point for managing who sees what data and under what conditions.
You can embed access control rules directly into the semantic model. For example, a `total_salary_cost` metric can be defined, but access can be restricted to users in the “Executive” or “Finance” groups. This rule is enforced universally, regardless of whether the user is accessing the data from Tableau or a Python script.
This becomes even more important as you begin to leverage AI and machine learning. AI models are notoriously sensitive to the quality and consistency of their input data. The principle of “garbage in, garbage out” has never been more true. By using a metrics layer to feed your AI models, you ensure they are trained on high-quality, consistent, and well-governed features. A churn prediction model trained on a centrally defined and trusted `customer_churn_rate` metric will produce far more reliable results than one trained on an ad-hoc dataset from a spreadsheet.
This centralization also provides a clear point for audit and compliance. When regulators ask how you calculate a specific financial figure, you can point to a single, version-controlled piece of code, not a dozen different reports with conflicting logic.
Your Next Steps: Building a Single Source of Truth
Ending the “data arguments” in your organization is an achievable goal. It starts by recognizing that the problem isn’t your people or your dashboards, but the absence of a shared language for your business metrics. A metrics layer provides that language.
Your path forward is an incremental one:
- Start the Conversation: Identify the most painful, inconsistent KPI in your company and bring the stakeholders together.
- Prove the Value: Use the step-by-step guide to launch a pilot project for that single metric. Focus on demonstrating speed, trust, and consistency.
- Treat Your Metrics Like a Product: Your metrics definitions are a valuable company asset. They require ownership, a development roadmap, and continuous improvement, just like any other critical software product.
By taking these deliberate steps, you can move from a state of data chaos to one of data clarity, building a resilient foundation for smarter, faster, and more confident decision-making.
Your Next Read:
Category:
Get a FREE
Proof of Concept
& Consultation
No Cost, No Commitment!
