Intelligex Logo
Intelligex Logo
[language-switcher]
Get A Consultation

Data, Analytics & Reporting

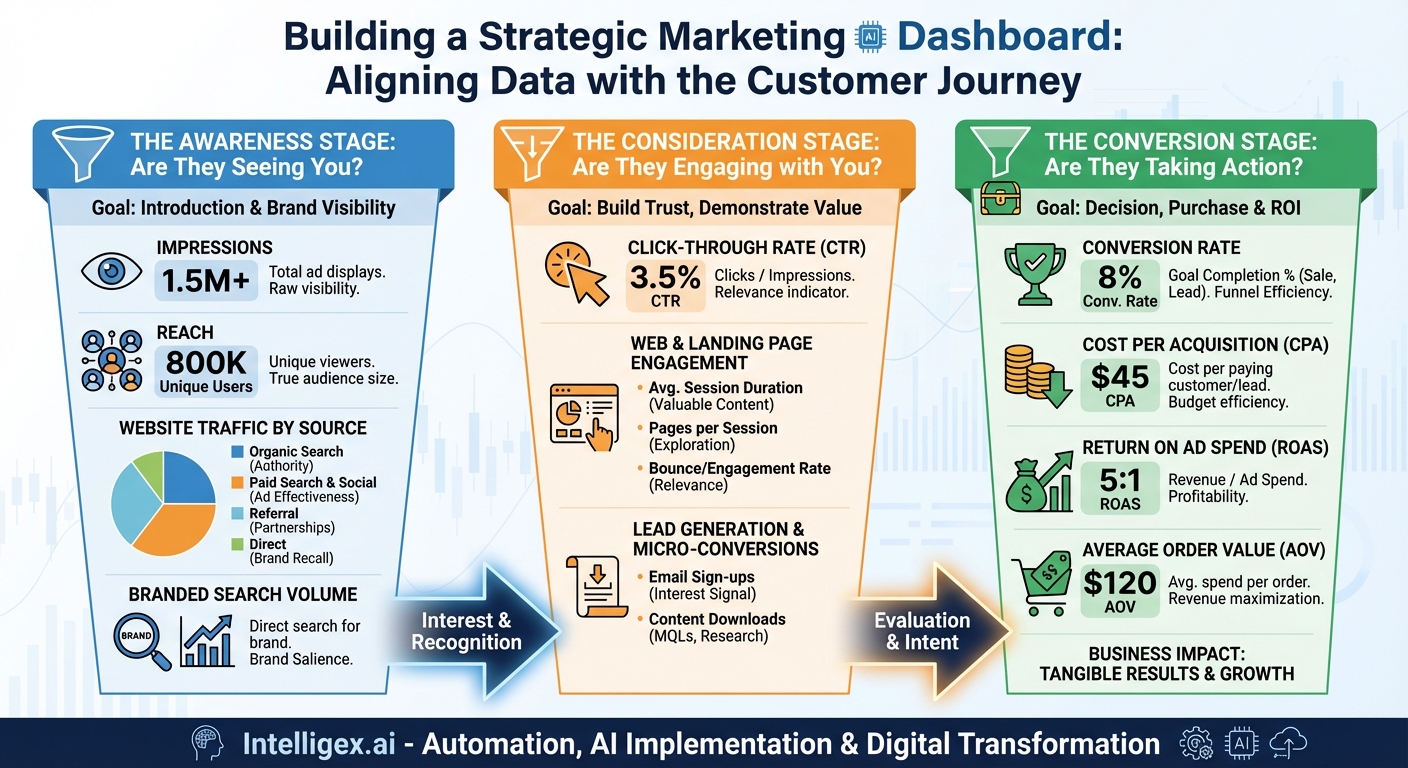
How to Build a Strategic Marketing Dashboard Aligned with the Customer Journey

12 April 2026|Data, Analytics & Reporting|

Digital marketing data can be overwhelming, leading to confusion instead of insight. The most effective way to gain clarity is to build a marketing dashboard structured around the customer journey. By organizing key metrics into Awareness, Consideration, and Conversion stages, you can transform your data into a clear narrative that helps you identify bottlenecks and make smarter, data-driven decisions.

How to Create a UTM Naming Convention for Clean, Actionable Marketing Data

10 April 2026|Data, Analytics & Reporting|

Inconsistent campaign tracking in platforms like Google Analytics leads to fragmented data, flawed attribution, and poor marketing decisions. This guide provides a practical framework for creating a robust UTM naming convention, outlining best practices for the five key parameters. By implementing these simple rules, you can clean up your reporting, clarify campaign performance, and confidently prove the value of your marketing efforts.

From Siloed Reports to Strategic Command Center: Building a Leadership RevOps Dashboard

6 April 2026|Data, Analytics & Reporting|

Leadership teams often struggle with siloed data that fails to explain the 'why' behind business performance. A strategic RevOps dashboard solves this by unifying data across the entire customer lifecycle, shifting the focus from tactical metrics to strategic insights. This provides a command center view of the revenue engine, enabling leaders to identify friction and make data-informed decisions for predictable growth.

8 Essential Metrics to Power Your HR Operations Dashboard

2 April 2026|Data, Analytics & Reporting|

An HR Operations Dashboard is a critical tool for modern HR departments to ensure core processes run efficiently. By providing a real-time view of key metrics like Time to Hire and HR Ticket Resolution Time, it allows leaders to identify bottlenecks, justify resources, and move from reactive problem-solving to proactive strategy. This article details eight essential metrics every HR operations team should track to demonstrate tangible value and drive performance.

Why Most Payroll Errors Start in HR: A Guide to Data Integrity

31 March 2026|Data, Analytics & Reporting|

Inaccurate HR data is the root cause of costly payroll errors, creating financial strain and eroding employee trust. This article explores the most common data mistakes, from incorrect compensation to delayed terminations, that directly impact paychecks. Learn how to build a resilient payroll process by implementing system integration, rigorous data audits, and automated workflows to ensure lasting data integrity.

Gain Financial Clarity in 15 Minutes: The 5 Metrics for Your Weekly Dashboard

28 March 2026|Data, Analytics & Reporting|

Navigating personal finances can feel overwhelming, leading to either anxious obsession or reactive panic. A weekly finance dashboard offers a powerful middle ground, transforming financial management into an empowering 15-minute habit. By consistently tracking a few key metrics, you can cut through the fog, reduce stress, and make intentional decisions that accelerate progress toward your goals.

Beyond Typos: Uncovering the Real Causes of Financial Data Entry Errors

26 March 2026|Data, Analytics & Reporting|

Inaccurate financial data entry is a costly vulnerability that undermines key business decisions. These errors are rarely simple typos, but rather symptoms of deeper issues stemming from human factors, flawed processes, and poor source document quality. Understanding these distinct root causes is the crucial first step toward building resilient systems that prevent mistakes and ensure a foundation of financial integrity.

From Data Chaos to Clarity: How to Build a Simple Data Flow Map for Your Business Team

19 March 2026|Data, Analytics & Reporting|

Business teams are often overwhelmed by disconnected data from various sources, making truly data-driven decisions difficult. This article introduces a powerful solution: a high-level data flow map designed for non-technical users. By visualizing your data's journey from source to destination, you can build trust in your reports, pinpoint process bottlenecks, and foster a culture of data clarity and confidence.

How to Fix the 5 Common Data Fields That Are Ruining Your Reports

18 March 2026|Data, Analytics & Reporting|

Inaccurate and unreliable reports often stem not from faulty tools, but from pervasive data inconsistency lurking in your raw data. Seemingly minor variations in dates, names, addresses, and categorical fields can cascade into major reporting errors, undermining trust in your analytics. This article dissects the most common culprits of data inconsistency and provides a strategic framework for cleaning existing data and preventing future issues, enabling you to build a foundation of reliable, actionable insights.

The Root Causes of Data Duplication: Unpacking Silos, Tech, and Human Behavior

14 March 2026|Data, Analytics & Reporting|

Data duplication is a costly, pervasive issue where teams across an organization work with conflicting versions of the same customer information. This problem isn't accidental; it stems from deep-rooted causes including organizational silos, fragmented technology, and human behaviors like a lack of process and trust. Recognizing these drivers is the critical first step for any business looking to establish a single source of truth and build a cohesive data strategy.

Go to Top