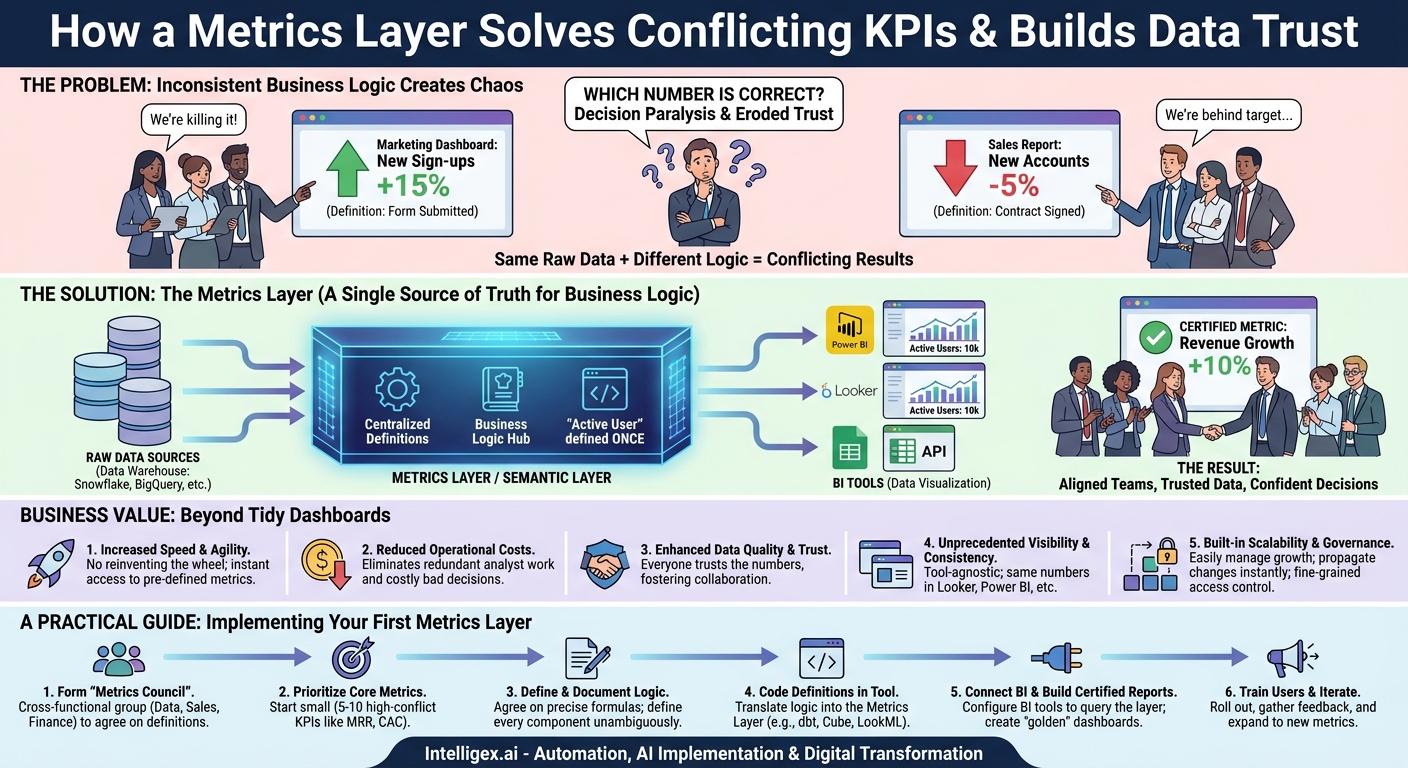
The Monday morning leadership meeting kicks off. The marketing team proudly presents a dashboard showing a 15% month-over-month increase in “New Customer Sign-ups.” A few minutes later, the sales team projects their report, indicating a 5% dip in “New Customer Accounts” for the same period. The room falls silent. The CFO looks from one screen to the other, and the operations lead sighs. Which number is correct? And more importantly, how much time will be wasted this week figuring it out?
This scenario is not a failure of technology. It is a failure of consistency. Both teams likely used powerful BI tools like Looker or Power BI. Both pulled data from the same data warehouse. The problem lies in the middle, in the unwritten, inconsistent business logic each team applied. Marketing defined a “new customer” when a form was submitted. Sales defined it when a contract was signed. Both are logical, but their conflict creates confusion, erodes trust in data, and paralyzes decision-making.
Fixing this isn’t about buying a new, bigger BI tool. It’s about fundamentally changing how you define and manage your key performance indicators (KPIs). The solution is to introduce a metrics layer, a central hub for business logic that sits between your data sources and your analytics tools, ensuring that everyone, everywhere, is speaking the same data language.
What is a Metrics Layer? A Single Source of Truth for Business Logic
Your data warehouse (like Snowflake, BigQuery, or Redshift) is your single source of truth for raw data. Your BI tools are your platforms for data visualization. A metrics layer, sometimes called a semantic layer, is the missing piece that creates a single source of truth for your business logic and definitions.
Imagine it as a central recipe book for your company’s metrics. Instead of each analyst trying to remember the complex recipe for “Customer Lifetime Value” or “Net Revenue Retention,” they simply request it by name from the metrics layer. The layer handles the complex calculation exactly the same way every single time, regardless of who is asking or which tool they are using.
This layer doesn’t store your data. It stores the definitions. For example, the definition for “Active User” might be:
- The old way (inconsistent): One analyst defines it as any user who logged in within 30 days. Another defines it as a user who completed a key action (like a purchase or search) within 14 days. This leads to conflicting reports.
- The new way (with a metrics layer): The definition “a user ID that has initiated a session event in the last 28 days” is coded once in the metrics layer. Now, when a team member in Looker or an executive in Power BI queries “Active Users,” they are both guaranteed to get a number based on that single, agreed-upon definition.
This simple concept has profound implications. It decouples the complex “how” of a calculation from the “what” of the business question. Your teams can focus on analyzing insights instead of debating definitions.
The Business Value: Beyond Tidy Dashboards
Implementing a metrics layer delivers far more than just consistent numbers. It drives tangible business value across several key areas by improving the speed, quality, and scalability of your entire data operation.
1. Increased Speed and Agility
Without a central definition hub, analysts spend an inordinate amount of time reinventing the wheel. A simple request like “What was our customer churn rate last quarter?” can trigger days of work, including finding the right tables, validating the logic with stakeholders, and building the calculation from scratch. With a metrics layer, pre-defined, trusted metrics like “Churn Rate” are available on demand. This transforms the data team from a bottleneck into an enabler.
- Before: An operations team needs to analyze inventory turnover. An analyst spends a week defining “cost of goods sold” and “average inventory” and building the query.
- After: The “Inventory Turnover” metric already exists. The analyst drags it into a Power BI report and can provide insights to the ops team the same day.
2. Reduced Operational Costs
Redundant work is expensive. Every hour a data engineer or analyst spends rebuilding a common metric is a waste of a high-value resource. A metrics layer eliminates this duplication of effort, freeing your technical talent to focus on more strategic initiatives like predictive modeling or building new data products.
Furthermore, the cost of bad decisions based on bad data can be astronomical. A marketing team overspending on a campaign because they are using an inflated “Customer Acquisition” number is a direct hit to the bottom line. By ensuring data quality and consistency, a metrics layer mitigates this financial risk.
3. Enhanced Data Quality and Trust
Trust is the currency of data. When leaders cannot trust the numbers they see, they revert to gut feelings and anecdotal evidence. A metrics layer is one of the most effective tools for building and maintaining that trust. When the finance, sales, and marketing departments all see the exact same “Monthly Recurring Revenue” (MRR) figure, they stop questioning the data and start collaborating on how to grow it. This alignment is a critical competitive advantage.
4. Unprecedented Visibility and Consistency
A true metrics layer is tool-agnostic. It serves the same consistent definitions to Looker, Power BI, Tableau, and even spreadsheets or custom applications via an API. This means a sales leader viewing a regional performance dashboard in Power BI sees the same “Quota Attainment %” as an executive reviewing the global summary in Looker. This consistency ensures that strategic conversations are based on a shared understanding of reality, not a debate over conflicting data points.
5. Built-in Scalability and Governance
As your organization grows, so does its data complexity. New departments, new products, and new data sources can quickly lead to analytical chaos. A metrics layer provides a scalable framework for managing this growth. When a new team needs access to core KPIs, you simply grant them access to the existing, certified metrics. When a metric definition needs to be updated (for example, to exclude a new type of discount from revenue), you change it in one place, and the update propagates instantly to every report and dashboard across the entire company.
A Practical Guide: Implementing Your First Metrics Layer
Adopting a metrics layer is a strategic project, not just a technical one. It requires collaboration between business and data teams. Following a structured process ensures a successful rollout that delivers immediate value and builds momentum for wider adoption.
- Form a Cross-Functional “Metrics Council”
Your first step is to assemble a small, dedicated group. This should include a data engineer or architect, a BI developer, and key stakeholders from at least two business departments that frequently experience KPI conflicts, such as Finance and Sales. This group will be responsible for defining and ratifying the initial set of metrics. - Identify and Prioritize Core Business Metrics
Do not try to boil the ocean. Start with a small set of 5 to 10 high-value, high-conflict metrics. These are the numbers that run your business and are most often debated. Good candidates include:- For Sales/Finance: Monthly Recurring Revenue (MRR), Customer Acquisition Cost (CAC), Gross Margin.
- For Marketing: Marketing Qualified Leads (MQLs), Lead-to-Customer Conversion Rate.
- For Operations/Supply Chain: On-Time Delivery Rate, Inventory Turnover.
- Define, Debate, and Document the Logic
This is the most critical and often most challenging step. The Metrics Council must sit down and agree on the precise, unambiguous formula for each chosen metric. Document every component. For MRR, this means answering questions like: Does it include usage-based fees? How are refunds and credits handled? Are trial periods included? The final, agreed-upon definition should be signed off on by all stakeholders. - Code the Definitions in Your Metrics Layer Tool
Once the logic is documented in plain English, your data team translates it into code using a metrics layer tool. This could be within Looker’s modeling language (LookML) if you are a Looker-only shop, or more flexibly in a dedicated tool like the dbt Semantic Layer or Cube, which can serve multiple downstream tools. This code becomes the single source of truth. - Connect Your BI Tools and Build Certified Reports
Configure Power BI and Looker to query the metrics layer for these newly defined metrics instead of hitting the raw database tables directly. Build a set of “certified” or “golden” dashboards using only these governed metrics. This gives users a clear place to go for trusted information. - Train Users, Gather Feedback, and Iterate
Roll out the new certified reports to a pilot group of users. Train them on what the metrics mean and where to find them. Emphasize that these numbers are the official company standard. Gather feedback on usability and any additional metrics they need, and use that to inform the next iteration of your rollout.
Choosing the Right Tools: Key Considerations
The market for metrics layer technology is evolving. Some BI platforms, like Looker, have strong built-in semantic modeling capabilities. Standalone tools like dbt Semantic Layer, Cube, and AtScale are designed to be universal, serving definitions to any BI tool. When evaluating your options, consider the following checklist:
- Integration with your stack: Does the tool connect seamlessly with your data warehouse (e.g., Snowflake, BigQuery) and your primary BI tools (Power BI, Looker, Tableau)?
- Governance and version control: Does it support Git-based workflows for tracking changes to definitions? Can you set role-based permissions to control who can see or edit metrics?
- Performance and caching: Can it pre-aggregate common queries to deliver fast dashboard performance? How does it scale with increasing data volumes and user concurrency?
- Developer experience: Is the language for defining metrics (often YAML or a similar format) intuitive and powerful for your data team?
- API access: Does it offer a robust API so you can pull governed metrics into other applications beyond BI tools, such as financial planning software or even AI models?
–
The right choice depends on your existing infrastructure and long-term goals. If your entire company is standardized on a single BI platform, its built-in layer might suffice. If you have a diverse ecosystem of tools, a universal, standalone metrics layer offers more flexibility and future-proofing.
Governance and Security in a Centralized System
Centralizing your business logic in a metrics layer not only improves consistency but also provides a powerful control point for data governance and security. This is especially critical when dealing with sensitive information or preparing data for AI and machine learning applications.
Fine-Grained Access Control
With a metrics layer, you can implement role-based access controls at a very granular level. For example, you can create a single “Revenue” metric but define rules so that a regional sales manager can only see the revenue for their specific territory, while the CFO can see the global total. Similarly, an HR analyst can view overall employee attrition rates without having access to the personally identifiable information (PII) of individual employees in the underlying tables. This enforces a “need-to-know” security principle directly within your data logic.
Ensuring Privacy and Compliance
Privacy regulations like GDPR and CCPA require careful handling of customer data. A metrics layer can be a key tool for compliance. You can programmatically apply data masking or anonymization rules within a metric’s definition. This ensures that any data reaching a BI tool or analyst has already been treated according to your privacy policies, reducing the risk of accidental data exposure.
Auditability and Change Management
When the definition of a core metric like “Gross Margin” changes, it can have a significant impact on financial reporting and strategic decisions. By managing your metrics definitions in a version control system like Git, you create a complete, auditable history of every change. If a number on a report suddenly looks different, you can trace it back to a specific code change, see who approved it, and understand the exact rationale. This transparency is crucial for maintaining trust and accountability.
Your Path Forward: Starting the Journey to Data Consistency
Resolving KPI conflicts and building a truly data-driven culture is a journey, not an overnight fix. The introduction of a metrics layer is the most impactful step you can take on that journey. It addresses the root cause of data chaos: inconsistent business logic.
The path forward doesn’t require a massive, multi-year overhaul. It starts with a single, painful problem. Find that one report where Sales and Finance always disagree. Use that as your pilot project. Assemble your Metrics Council, hammer out the definitions for the three or four KPIs that cause the most friction, and implement them in a metrics layer.
By solving that one problem, you will demonstrate immense value. You will save countless hours of manual reconciliation, build trust between departments, and enable faster, more confident decisions. That success will build the momentum you need to expand the practice, one trusted metric at a time, until your entire organization is operating from a single, consistent, and reliable source of truth.
Your Next Read:
Category:
Get a FREE
Proof of Concept
& Consultation
No Cost, No Commitment!