

Your business runs on processes. From onboarding a new hire to paying a vendor invoice, these sequences of tasks are the gears that keep your organization moving. But what happens when those gears grind? When steps are missed, approvals are delayed, and nobody is quite sure who is responsible for what, the result is friction. This friction costs you time, money, and quality. The problem is that these critical processes are often invisible, living only in the minds of a few key employees or buried in outdated, unread documents.
There is a powerful, low-tech way to bring these hidden workflows into the light: one-page process mapping. It’s a method for creating a single, shared view of how work actually gets done. By dedicating a few hours to this exercise, teams can uncover bottlenecks, identify automation opportunities, and build a foundation for scalable, efficient operations. This is not about creating a massive binder of charts that gathers dust. It’s about creating a practical tool for immediate action and improvement.
What is One-Page Process Mapping (and Why Isn’t It Just a Flowchart)?
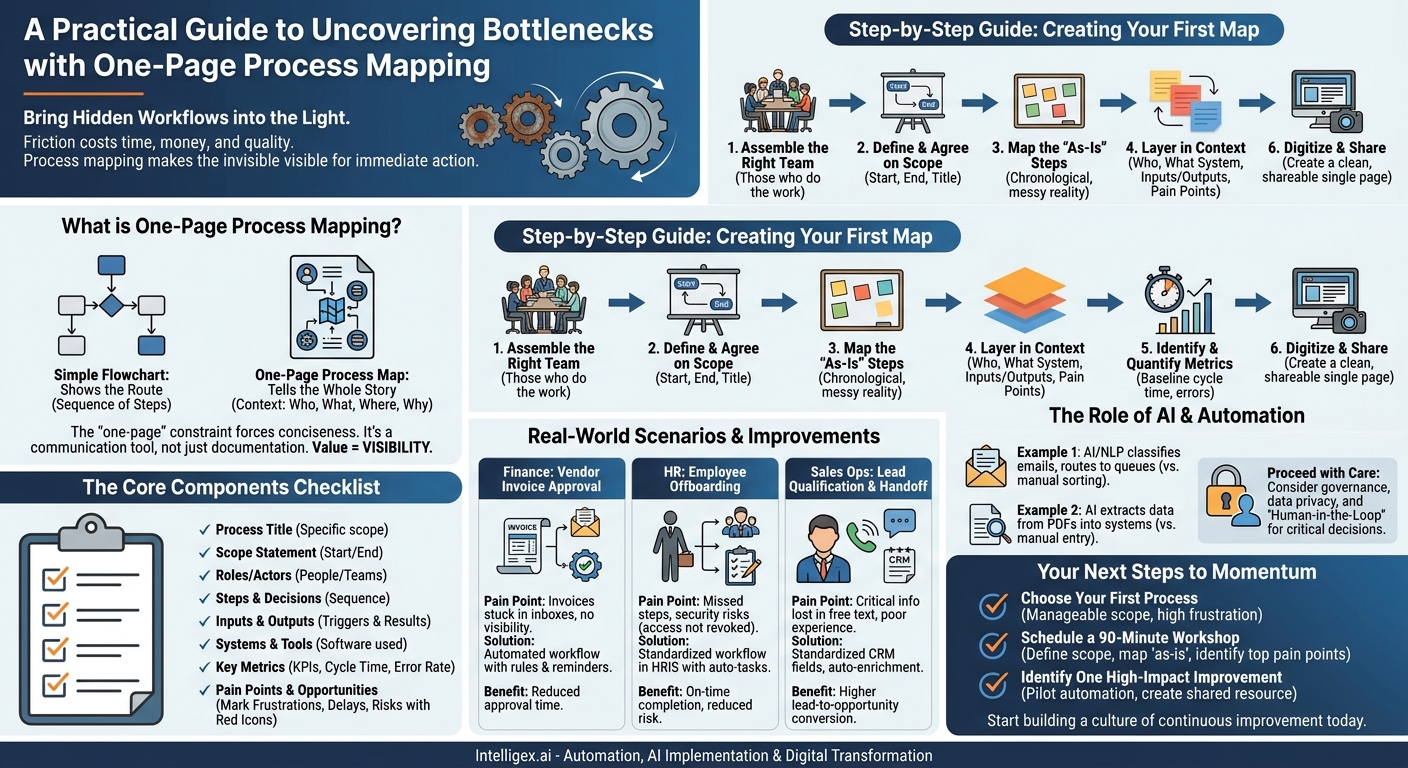
At its core, a one-page process map is a visual, comprehensive summary of an entire business process on a single document. The “one-page” constraint is its superpower. It forces you to be concise and focus on what truly matters, making the output easy for anyone in the organization to understand at a glance. It’s a communication tool first and a documentation artifact second.
While it often includes flowchart elements like boxes and arrows, a robust process map goes much further. A simple flowchart shows the sequence of steps. A one-page process map tells the whole story. It adds critical context that reveals the “why” and “how” behind the “what.” This includes:
- Who: The specific roles or teams responsible for each step.
- What: The key inputs, activities, and outputs.
- Where: The systems, tools, or platforms used to perform the work.
- Why: The pain points, bottlenecks, and opportunities for improvement.
Think of it as the difference between a simple road map and a satellite image overlaid with traffic data, points of interest, and weather conditions. The first just shows you the route; the second gives you the complete operational picture needed to make intelligent decisions. The primary business value here is visibility. When everyone, from a new hire to a department head, can look at a single page and understand how a process works, you eliminate ambiguity and create a shared basis for improvement.
The Core Components of a One-Page Process Map
To be effective, your map needs to capture the right information. While the layout can be flexible (some use swimlanes for different roles, others use a more linear flow), the most valuable maps consistently include the same core components. As you build your map, treat the following as a checklist to ensure you are capturing the full picture.
Essential Information Checklist:
- Process Title: Be specific. “Hiring” is too broad. “New US Salaried Employee Onboarding” is better. It clearly defines the scope.
- Scope Statement: A simple sentence defining the start and end points. For example, “Begins when a candidate signs an offer letter and ends after the successful completion of the 30-day new hire check-in.” This prevents scope creep during your mapping session.
- Roles (or Actors): List every person or team involved, from the person who kicks off the process to the person who finishes the final step. Examples include Hiring Manager, HR Coordinator, IT Support, and the New Hire.
- Steps and Decisions: The sequence of actions and key decision points (e.g., “Approve Expense?”). This is the backbone of your map.
- Inputs and Outputs: What triggers each step, and what is the tangible result? An input could be a “Completed Expense Form,” and the output might be a “Payment Record in ERP.”
- Systems and Tools: Note the specific software or platform used at each step. Are you using Workday for HR actions, Salesforce for customer data, Jira for tasks, or a shared spreadsheet for tracking? This is critical for identifying integration opportunities.
- Key Metrics (KPIs): How do you know if the process is healthy? Measure what matters. This could be cycle time (how long it takes from start to finish), error rate, or cost per transaction. If you don’t know the current numbers, that’s an important finding in itself.
- Pain Points and Opportunities: This is where the real value is unlocked. Use a different color sticky note or a specific icon to mark areas of frustration, delay, risk, or manual effort. Is there a step that always causes confusion? A system that requires duplicate data entry? Mark it.
By including all these elements, you move beyond a simple diagram to a rich diagnostic tool that highlights exactly where your process is succeeding and where it is failing.
A Practical Step-by-Step Guide to Creating Your First Map
Mapping a process doesn’t require expensive software or specialized training. It requires a whiteboard (or a virtual equivalent like Miro), a pack of sticky notes, and the right people in the room. The goal of the first session is to get a “good enough” version of the current state, or “as-is” process, documented.
- Assemble the Right Team. This is the most critical step. Your mapping team must include the people who actually perform the work every day. A manager’s perception of a process is often very different from the reality on the ground. Invite representatives from each role involved in the process, and ensure you have a facilitator to guide the conversation and keep it on track.
- Define and Agree on the Scope. Before anyone places a sticky note, get everyone to agree on the process title and the start and end points. Write it clearly at the top of the whiteboard. This prevents the conversation from drifting into other related, but distinct, processes. Start with the “happy path” first, the most common way the process is completed without exceptions. You can address exceptions later.
- Map the “As-Is” Steps. Give each participant sticky notes and ask them to write down the individual tasks they perform. Then, as a group, arrange them in chronological order on the whiteboard. Don’t worry about perfection yet. Focus on capturing the real, messy way work gets done today, not the way it’s documented in a formal procedure manual. This honesty is crucial.
- Layer in the Context. Once the basic flow is established, go back through the map and add the other core components. Use different colored sticky notes for clarity. For each step, ask questions: Who is responsible for this? What system do you use? What information do you need to start this task? What is the output? Where do you feel a sense of frustration or delay here?
- Identify and Quantify Metrics. Now, look at the process as a whole. Ask the team: “How long does this entire process usually take?” or “What percentage of the time do we have to redo this step because of an error?” Get baseline measurements, even if they are estimates. This will be your benchmark for measuring the impact of any improvements you make.
- Digitize and Share. The whiteboard is a great tool for collaboration, but it’s not a permanent record. Take a photo, then transfer the map into a cleaner digital format. A simple slide or a dedicated diagramming tool works well. The goal is to have a clean, readable, one-page document that you can share widely. This artifact becomes the single source of truth for how the process operates.
Real-World Scenarios: Putting Mapping into Practice
Process mapping is a versatile tool applicable to any department. The value becomes clear when you apply it to specific, common business challenges.
Finance: Vendor Invoice Approval
- Common Process: An invoice arrives via email, is manually entered into the accounting system, forwarded to a department head for approval, and then sent back to accounts payable for payment.
- Pain Point Discovered: The map reveals that invoices frequently get stuck in managers’ inboxes for days, risking late payment fees. There’s no visibility into where an invoice is in the approval chain.
- Key Metric: Average Invoice Approval Time.
- Improvement Opportunity: Implement an automated workflow that routes invoices for approval based on pre-set rules (e.g., amount, vendor) and sends automatic reminders, drastically reducing the approval cycle time.
Human Resources: Employee Offboarding
- Common Process: A manager sends an email to HR, who then manually creates tasks for IT (disable access), facilities (collect assets), and payroll (process final pay).
- Pain Point Discovered: The map shows there is no central checklist, and steps are often missed. On several occasions, a former employee’s system access was not revoked until days after their departure, posing a significant security risk.
- Key Metric: On-Time Offboarding Task Completion Rate.
- Improvement Opportunity: Create a standardized offboarding workflow in a project management tool or HRIS. When an employee’s termination date is entered, it automatically generates and assigns all necessary tasks to the correct departments with clear deadlines.
Sales Operations: Lead Qualification and Handoff
- Common Process: A new lead comes in from the website, marketing qualifies it via a phone call, and then manually reassigns the record in the CRM to a sales representative.
– Pain Point Discovered: The map highlights that critical information gathered during the marketing call is often logged in a free-text notes field, which the sales rep misses. The rep then has to re-ask the same questions, creating a poor customer experience.
– Key Metric: Lead-to-Opportunity Conversion Rate.
– Improvement Opportunity: Standardize the data capture process by adding required fields to the CRM. Use an integration tool to automatically enrich lead data with company size and industry, giving the sales rep more context and saving them research time.
From “As-Is” to “To-Be”: Driving Real Business Value
The “as-is” process map is not the final destination. It is a diagnostic tool that empowers you to design a better future state, or “to-be” process. By analyzing the pain points and bottlenecks you’ve identified, you can target improvements that deliver tangible business results across four key areas.
Speed: The map will clearly show you where work stops and waits. These are your bottlenecks. Is there a single person who is an approval bottleneck? Is there a long delay while waiting for information from another department? By redesigning the flow to remove or reduce these waiting periods, you can dramatically accelerate the entire process cycle time.
Cost: Look for low-value, repetitive, manual tasks on your map. A team member spending hours each week copying and pasting data between a spreadsheet and an ERP system is a direct labor cost. Quantify it. For example, five hours per week at a loaded salary rate is a significant annual expense. These tasks are prime candidates for automation, freeing up your employees to focus on higher-value work.
Quality: Where do errors happen? The map will point to steps where information is entered manually, where handoffs are poorly defined, or where instructions are unclear. By standardizing inputs, automating data transfer, and adding validation checks, you can significantly reduce the error rate, leading to less rework, higher customer satisfaction, and lower operational risk.
Scalability: A process that relies on one person’s “tribal knowledge” cannot scale. When that person is on vacation or leaves the company, the process breaks down. A well-mapped process is explicit and transferable. It becomes a training tool for new team members and a blueprint for standardizing operations across different regions or business units, allowing you to grow without chaos.
The Role of AI and Automation in Process Improvement
Once you have a clear process map, the opportunities to apply modern technology like AI and automation become obvious. Instead of chasing buzzwords, you can take a targeted, value-driven approach. Your map serves as a blueprint for intelligent transformation.
For example, if your map shows a step where a team member manually reads customer emails to determine if they are “Urgent” or “Non-Urgent,” you have found a perfect use case for a natural language processing (NLP) model. This AI can be trained to classify incoming messages automatically, routing them to the right queue and freeing up your team to solve problems rather than sort them.
Similarly, if your supply chain map reveals a step where someone has to manually extract line-item data from PDF purchase orders to enter it into SAP, that is a clear signal for an AI-powered document processing solution. These tools can read and understand unstructured documents, extract the relevant data, and input it into your systems of record with high accuracy, turning a multi-hour task into a multi-minute one.
When implementing these technologies, it’s important to proceed with care. Always consider the governance and safety aspects. If you’re automating a process that involves sensitive customer data, ensure you have strong data privacy and access controls in place. For critical decisions, especially in areas like finance or compliance, implement a “human-in-the-loop” review. This means the AI makes a recommendation or does the heavy lifting, but a person provides the final verification. The goal is to augment your team’s capabilities, not to replace their judgment without proper oversight.
Your Next Steps: From Map to Momentum
A process map on its own changes nothing. Its value comes from the conversations it sparks and the actions it drives. The journey from a tangled, invisible process to a streamlined, visible one is a marathon, not a sprint. But you can start today with a few simple steps.
- Choose Your First Process. Don’t try to map your entire business at once. Pick one process that is a known, persistent source of frustration but is manageable in scope. The vendor invoice approval process is often a great place to start.
- Schedule a 90-Minute Workshop. Block time on the calendars of the key people who perform the process every day. Set a clear agenda: define the scope, map the “as-is” steps, and identify the top three pain points.
- Identify One High-Impact Improvement. From that initial session, choose a single, achievable improvement. Don’t try to fix everything. Maybe it’s as simple as creating a shared email inbox to prevent requests from getting lost, or as ambitious as piloting an automation tool for one step.
By taking this first small step, you build momentum. A successful first project demonstrates the value of this approach and creates the appetite for more. Process mapping is not a one-time event; it is the foundational skill for building a culture of continuous improvement, one page at a time.
Your Next Read:
Category:
Get a FREE
Proof of Concept
& Consultation
No Cost, No Commitment!
