In the modern digital landscape, executives are often drowning in data yet starving for wisdom. You’re presented with dashboards packed with dozens of metrics: website traffic, social media engagement, click-through rates, bounce rates, and a dizzying array of acronyms. While each of these data points tells a small part of the story, they often fail to answer the most critical question: Are our digital operations actually driving the core financial and strategic goals of the business?
The common approach of a flat, sprawling dashboard is fundamentally flawed. It presents every metric as equally important, making it impossible to distinguish a critical signal from background noise. A sudden drop in organic search traffic feels just as alarming as a rise in customer churn, even though their long-term business impact is vastly different. This lack of hierarchy leads to reactive, tactical decision-making rather than proactive, strategic leadership.
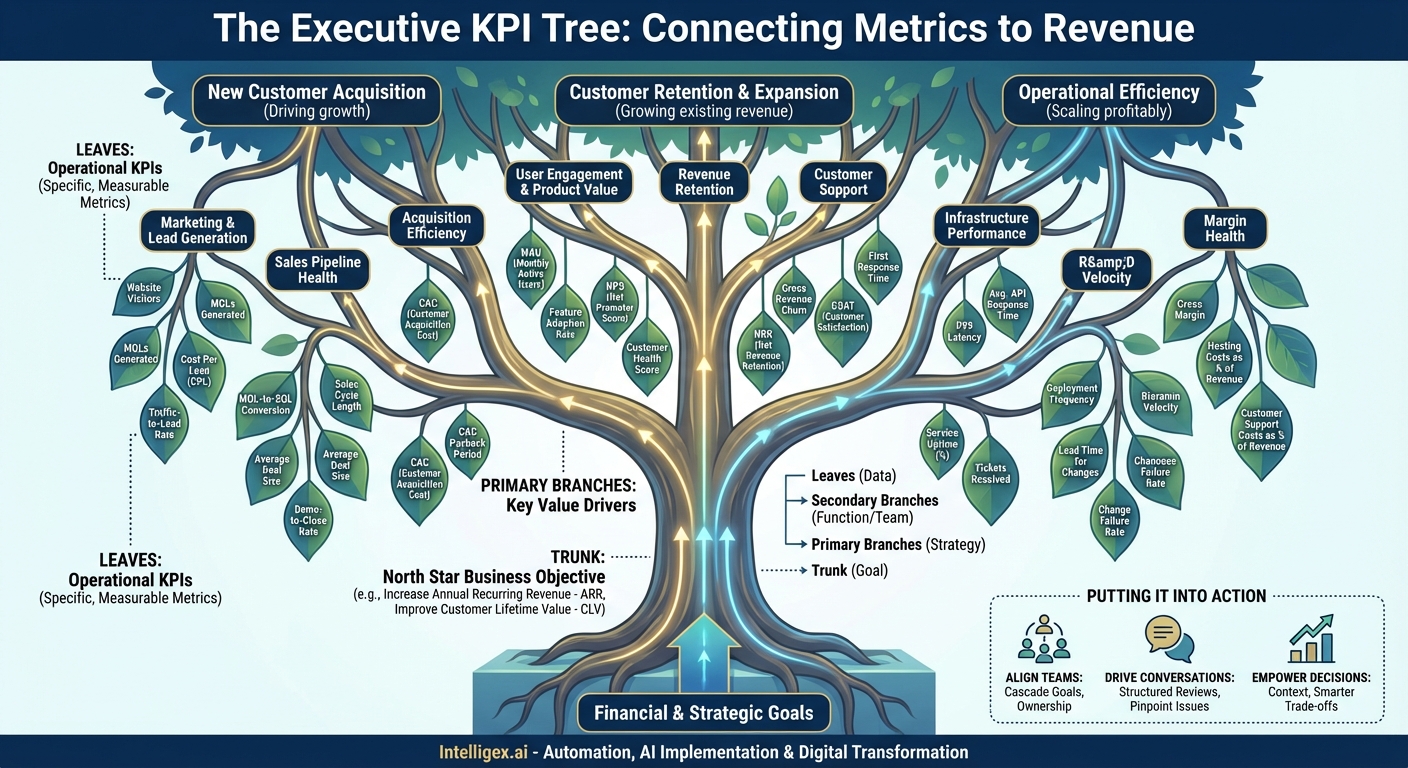
The solution is to move away from a “sea of metrics” and toward a structured, hierarchical model: The Executive KPI Tree for Digital Operations. This framework organizes your metrics in a logical, cause-and-effect structure that directly connects every operational activity to the ultimate business objectives. Think of it as an organizational chart for your data, ensuring every metric has a clear purpose and a direct line of sight to the top-line goals that matter to the C-suite and the board.
The Anatomy of a KPI Tree
A KPI tree isn’t just a random collection of metrics; it’s a carefully constructed model with distinct levels, each feeding into the one above it. This structure provides clarity, alignment, and a powerful diagnostic tool for understanding business performance.
The Trunk: The North Star Business Objective
The base of your entire tree—the trunk—is not a digital metric. It is the single most important, high-level business outcome your digital operations are meant to influence. This is the goal that the CEO, CFO, and board of directors care about most deeply. Choosing the right trunk is the most critical step in building a useful KPI tree.
Examples of strong “Trunk” objectives include:
- Increase Annual Recurring Revenue (ARR) for a SaaS business.
- Improve Customer Lifetime Value (CLV) for an e-commerce company.
- Reduce Blended Customer Acquisition Cost (CAC) for a high-growth startup.
- Increase Gross Margin for a digital services firm.
Notice that “increase website traffic” or “get more followers” are not on this list. Those are activities, not ultimate business outcomes. The trunk must be a financial or core strategic goal that defines success for the entire organization.
The Primary Branches: Key Value Drivers
Growing from the trunk are the primary branches. These represent the main levers or high-level strategies you can pull to directly impact the North Star objective. If your trunk is to Increase ARR, your primary branches are the fundamental components of that growth. They answer the question, “What are the big, distinct ways we can achieve our main goal?”
For a trunk of Increase ARR, the primary branches might be:
- New Customer Acquisition: Driving growth by winning new business.
- Customer Retention & Expansion: Growing revenue from the existing customer base.
- Operational Efficiency: Ensuring the business can scale profitably and reliably.
These branches are mutually exclusive but collectively exhaustive. Together, they form the complete picture of how the trunk goal can be achieved. They provide immediate focus for executive-level conversations.
The Secondary Branches: Strategic Functions
Each primary branch is supported by smaller, secondary branches. These represent the specific functions, teams, or strategic initiatives responsible for executing on the key value drivers. This is where we begin to connect high-level strategy to departmental execution.
Continuing our Increase ARR example:
- Under the New Customer Acquisition branch, you might have secondary branches for:
- Marketing & Lead Generation
- Sales Funnel Performance
- Under the Customer Retention & Expansion branch:
- Product Engagement & Value Delivery
- Customer Success & Support
- Under the Operational Efficiency branch:
- Platform Performance & Reliability
- Cost of Goods Sold (COGS) Management
The Leaves: The Operational KPIs
Finally, we arrive at the leaves. These are the specific, granular, and measurable Key Performance Indicators (KPIs) that your teams monitor and influence on a daily or weekly basis. Each leaf hangs on a specific branch, meaning every operational metric has a clear and direct purpose. When a leaf metric changes, you immediately understand which strategic function it impacts, which key value driver it affects, and how it ultimately rolls up to the North Star objective.
This is where the familiar digital metrics find their proper home:
- On the Marketing & Lead Generation branch, leaves could include: Marketing Qualified Leads (MQLs), Cost per MQL, Traffic-to-Lead Conversion Rate.
- On the Product Engagement branch, leaves could include: Daily Active Users (DAU), Key Feature Adoption Rate, User Churn Rate.
- On the Platform Performance branch, leaves could include: Website Uptime, Average Page Load Time, API Error Rate.
The magic of the tree is that a conversation can now happen. If the MQLs (a leaf) are down, the executive team immediately understands it threatens the New Customer Acquisition driver (a primary branch), which in turn puts the entire ARR goal (the trunk) at risk. This context is what flat dashboards completely miss.
A Practical Example: The SaaS Company KPI Tree
Let’s build out a more detailed tree for a hypothetical B2B SaaS company. This is the kind of structure you can discuss in a board meeting to tell a complete and coherent story of the business’s health.
Trunk: Increase ARR by 25% Year-over-Year
Primary Branch 1: New Customer Acquisition
This branch focuses on adding new logos and new revenue streams to the business.
- Secondary Branch: Top-of-Funnel Marketing
- Leaves (KPIs): Website Visitors, MQLs Generated, Cost Per Lead (CPL)
- Secondary Branch: Sales Pipeline Health
- Leaves (KPIs): MQL-to-SQL Conversion Rate, Sales Cycle Length, Average Deal Size, Demo-to-Close Rate
- Secondary Branch: Acquisition Efficiency
- Leaves (KPIs): Customer Acquisition Cost (CAC), CAC Payback Period
Primary Branch 2: Customer Retention & Expansion
This branch is all about keeping customers happy and growing their spend over time—often the most profitable source of growth.
- Secondary Branch: User Engagement & Product Value
- Leaves (KPIs): Monthly Active Users (MAU), Feature Adoption Rate, Net Promoter Score (NPS), Customer Health Score
- Secondary Branch: Revenue Retention
- Leaves (KPIs): Gross Revenue Churn, Net Revenue Retention (NRR), Expansion MRR (Monthly Recurring Revenue)
- Secondary Branch: Customer Support
- Leaves (KPIs): First Response Time, Customer Satisfaction (CSAT), Tickets Resolved
Primary Branch 3: Operational & Financial Efficiency
This branch ensures the business can deliver its service reliably and profitably as it scales.
- Secondary Branch: Infrastructure Performance
- Leaves (KPIs): Service Uptime (%), Average API Response Time, P99 Latency
- Secondary Branch: R&D Velocity
- Leaves (KPIs): Deployment Frequency, Lead Time for Changes, Change Failure Rate
- Secondary Branch: Margin Health
- Leaves (KPIs): Gross Margin, Hosting Costs as % of Revenue, Customer Support Costs as % of Revenue
Putting the KPI Tree into Action
Creating the diagram is only the first step. The true power of the KPI tree is realized when it’s embedded into the operational rhythm of your business.
1. Aligning Teams and Cascading Goals: The tree becomes your framework for goal setting. The executive team owns the trunk. VPs or Directors own the primary branches. Managers and team leads own the secondary branches and the leaves. A marketing manager isn’t just tasked with “increasing leads”; they are tasked with hitting an MQL target that is mathematically linked to the company’s overall new business revenue goal.
2. Driving Strategic Conversations: Your weekly and monthly business reviews should be structured around the tree. Instead of randomly jumping between metrics, you can walk the tree. “How are we tracking on our ARR goal? Let’s look at the primary drivers. New acquisition is slightly behind plan. Let’s drill down. It looks like our MQL-to-SQL conversion rate dropped. Why is that happening?” This structured inquiry allows you to pinpoint problems and their root causes with incredible speed and precision.
3. Empowering Data-Driven Decisions: The KPI tree helps everyone in the organization understand how their work matters. An engineer working to improve API response time (a leaf) can see a direct line from their work to Platform Performance, to Operational Efficiency, and finally to the company’s ability to scale profitably. This creates a culture of ownership and empowers teams to make smarter trade-offs, because they understand the full context of their work.
By moving from a flat dashboard to a dynamic KPI tree, you transform your relationship with data. It ceases to be a source of confusion and becomes your most powerful tool for clarity, alignment, and strategic execution. You stop managing metrics and start leading the business. Begin by identifying your one true “trunk” objective, and start building the branches that will support its growth.
Related Posts
Category:
Get a FREE
Proof of Concept
& Consultation
No Cost, No Commitment!