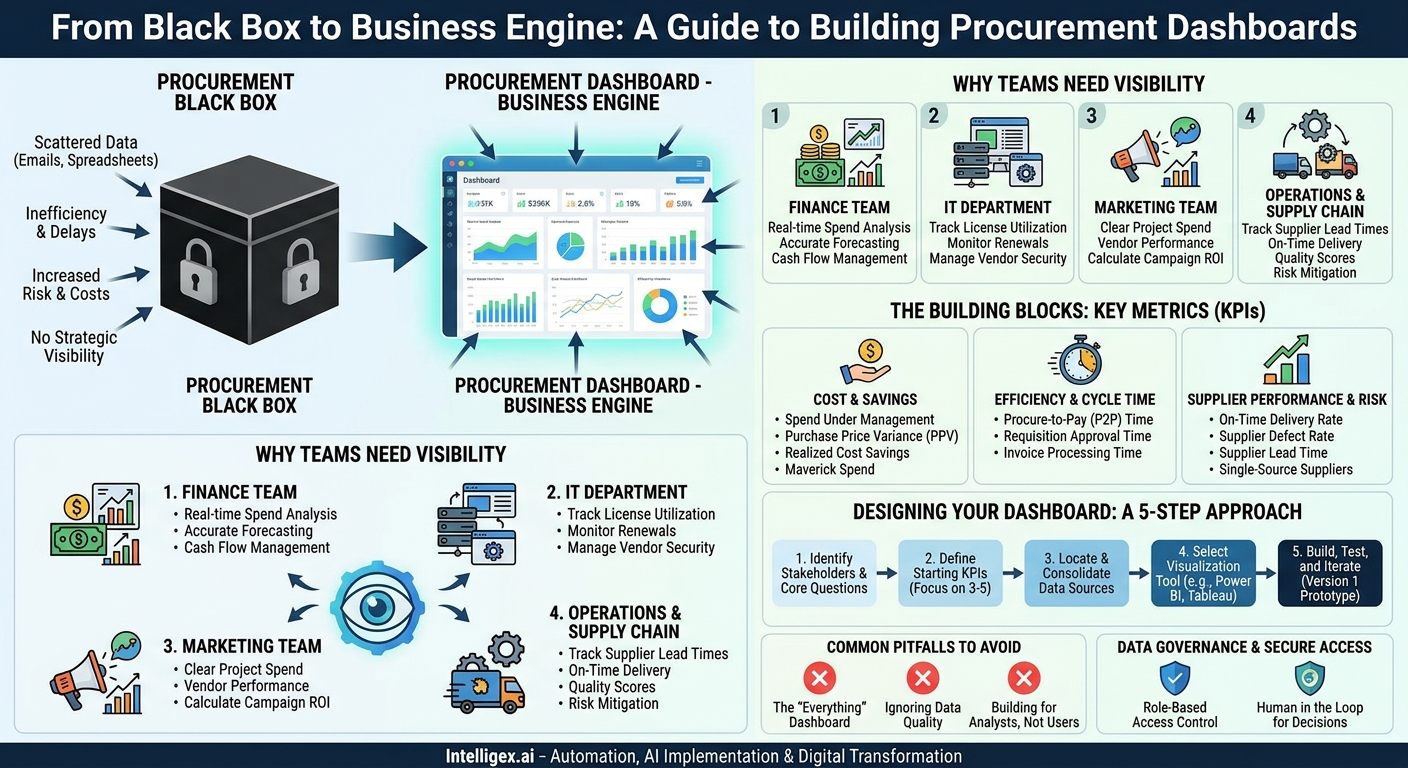
Procurement is the engine of your business, responsible for acquiring every good and service your teams need to operate. Yet for many organizations, it’s a black box. When a marketing team asks, “What’s the status of our agency contract renewal?” or finance asks, “Are we on track with our Q3 departmental budget?” the answer is often a series of emails, spreadsheet searches, and frustrating delays. This lack of visibility doesn’t just slow things down; it introduces risk, inflates costs, and prevents strategic decision-making.
The solution isn’t another layer of process. It’s a single source of truth: a procurement dashboard. A well-designed dashboard transforms scattered data from ERPs, contracts, and purchase orders into clear, actionable insights. It provides the visibility needed to move faster, control costs, and make smarter purchasing decisions across the entire organization.
Why Your Teams Need Procurement Visibility (And What They’re Missing Without It)
A procurement dashboard isn’t just for the procurement department. It’s a critical tool for any team leader who manages a budget or relies on external vendors. When data is siloed, every department feels the pain differently, but the result is the same: inefficiency and missed opportunities.
Consider these common scenarios:
- The Finance Team: Without a centralized view, tracking budget versus actual spend is a painful, manual process done weeks after the month closes. Finance leaders can’t proactively identify departments at risk of overspending or spot opportunities for cost savings until it’s too late. A dashboard gives them real-time spend analysis, helping with accurate forecasting and cash flow management.
- The IT Department: IT manages a complex web of software licenses, hardware assets, and service contracts. A lack of visibility means they might be paying for hundreds of unused software seats or miss a critical hardware refresh cycle, leading to security vulnerabilities. A dashboard helps them track license utilization, monitor contract renewal dates, and manage vendor security compliance in one place.
- The Marketing Team: Marketing relies heavily on agencies, freelancers, and technology vendors. Without a clear view of project-based spend and vendor performance, it’s nearly impossible to calculate the true return on investment (ROI) for a campaign. A dashboard can connect project costs to outcomes, helping leaders allocate their budget more effectively.
- The Operations and Supply Chain Teams: These teams live and die by supplier performance. A delay from a single critical supplier can bring a production line to a halt. A dashboard that tracks supplier lead times, on-time delivery rates, and quality scores allows them to identify and mitigate risks before they become crises.
Ultimately, a procurement dashboard delivers business value across four key pillars: speed (faster approvals and issue resolution), cost (reduced off-contract spending and better negotiations), quality (tracking supplier performance), and scalability (managing growth without adding manual overhead).
The Building Blocks: What Metrics Actually Matter?
The most common mistake when building a dashboard is trying to measure everything. The goal is clarity, not complexity. A powerful dashboard focuses on a handful of Key Performance Indicators (KPIs) that directly answer your most pressing business questions. Start by organizing your metrics into categories that align with your business goals.
Cost and Savings Metrics
These metrics help you understand where money is going and identify opportunities to save it.
- Spend Under Management: What percentage of your company’s total spend is actively managed by the procurement process? A higher percentage indicates better control and visibility.
- Purchase Price Variance (PPV): The difference between the standard or expected cost of an item and the actual amount paid. This helps you track the effectiveness of your negotiations.
- Realized Cost Savings: The tangible, hard-dollar savings achieved through negotiations, volume discounts, or switching to more cost-effective suppliers.
- Maverick Spend: Also known as off-contract or rogue spend, this is the value of purchases made outside of approved processes and vendors. It’s a primary source of risk and missed savings.
Efficiency and Cycle Time Metrics
These KPIs measure the speed and smoothness of your procurement operations.
- Procure-to-Pay (P2P) Cycle Time: The total time it takes from the moment a purchase requisition is created to the moment the final payment is made to the supplier. A long cycle time can delay projects and strain vendor relationships.
- Requisition Approval Time: The average time it takes for a purchase request to go through all necessary approvals. This is often a major bottleneck that frustrates business teams.
- Invoice Processing Time: The time from receiving a vendor invoice to approving it for payment. Faster processing can allow you to capture early payment discounts.
Supplier Performance and Risk Metrics
These metrics help you evaluate the reliability of your partners and the resilience of your supply chain.
- On-Time Delivery Rate: The percentage of orders delivered by the promised date. This is a fundamental measure of supplier reliability.
- Supplier Defect Rate: The percentage of products or services received that do not meet quality specifications.
- Supplier Lead Time: The average time from placing an order with a supplier to receiving the goods.
- Number of Single-Source Suppliers: Tracking how many critical components or services come from a single vendor helps you identify concentration risk in your supply chain.
Designing Your First Procurement Dashboard: A 5-Step Approach
Building a dashboard can feel intimidating, but a structured approach makes it manageable. The key is to start small, focus on a specific problem, and iterate based on user feedback. Think of it as building a product for your internal teams, not just a technical report.
- Identify Key Stakeholders and Their Core Questions. Before you look at any data, talk to the people who will use the dashboard. Sit down with a manager from Finance or IT and ask them: What is the most frustrating part of the current purchasing process? What information do you need to make better decisions, but can’t easily find? Frame the project around answering these specific questions, such as “Which departments are responsible for the most maverick spend?” or “Which of our software contracts are up for renewal in the next 90 days?”
- Define Your Starting KPIs. Based on the stakeholder interviews, choose three to five metrics that directly address their pain points. Do not try to build the “everything” dashboard from day one. If the primary pain point is budget overruns, start with Spend vs. Budget, Maverick Spend by Department, and Top 10 Vendors by Spend. A focused dashboard that solves a real problem is far more valuable than a cluttered one that tries to do everything.
- Locate and Consolidate Your Data Sources. This is often the most challenging step. Your procurement data likely lives in multiple systems: an ERP for purchase orders and invoices, a contract management system for agreements, and maybe even spreadsheets for tracking specific projects. Identify the primary source for each of your chosen KPIs. Acknowledge that the data may not be perfect, but don’t let that stop you. The visibility from a first-pass dashboard can often create the business case for improving data quality later.
- Select the Right Visualization Tool. You don’t need a complex, custom-built solution to get started. Many powerful tools are available that can connect to various data sources. Popular options like Microsoft Power BI and Tableau are designed for business users and offer pre-built connectors for common systems. In some cases, the built-in dashboarding capabilities of your existing ERP or e-procurement platform may be sufficient for your initial needs.
- Build, Test, and Iterate. Create a simple prototype (Version 1) of your dashboard with your chosen KPIs. Share it with your initial stakeholders and ask for feedback. Is it intuitive? Does it answer their questions quickly? Is anything missing or confusing? Use this feedback to refine the dashboard. This iterative process ensures you build a tool that people will actually use and trust.
Common Pitfalls and How to Avoid Them
Many dashboard projects fail not because of technology, but because of a few common, avoidable mistakes. Being aware of these traps from the start can dramatically increase your chances of success.
Pitfall 1: The “Everything” Dashboard. The temptation is to include every possible metric on a single screen. This leads to a cluttered, confusing interface that overwhelms users and hides the most important insights. Avoid it by: Creating separate, focused dashboards for different audiences. The CFO needs a high-level financial overview, while a category manager needs detailed supplier performance data.
Pitfall 2: Ignoring Data Quality. Your dashboard is only as trustworthy as the data behind it. If your source systems contain duplicate vendor entries, incorrect coding, or missing invoice dates, your dashboard will reflect that chaos. This is the fastest way to lose user trust. Avoid it by: Performing a basic data quality check before you build. Identify and fix the most glaring issues first. Use the dashboard itself to highlight data inconsistencies, creating momentum for a broader data cleanup initiative.
Pitfall 3: Building for Analysts, Not Business Users. Dashboards built by data experts can sometimes be too complex for the intended audience. They may be technically impressive but fail to answer simple business questions in an intuitive way. Avoid it by: Involving your end-users in the design process from day one. Ask them to “think out loud” as they use a prototype. If they can’t find an answer in 10-15 seconds, the design needs to be simplified.
A Note on Data Governance and Secure Access
As you centralize valuable procurement data, establishing clear governance rules is essential. This isn’t about creating bureaucracy; it’s about ensuring the right people have access to the right information securely and responsibly. A well-governed dashboard builds trust and protects sensitive company information.
Start with two simple principles:
- Role-Based Access Control: Not everyone needs to see everything. An IT manager needs to see detailed software contract terms, but a marketing manager does not. Implement access controls based on an individual’s role and responsibilities. This protects confidential information (like negotiated pricing or payment terms) and prevents users from being overwhelmed by irrelevant data.
- The Human in the Loop: A dashboard is a tool for decision support, not a replacement for professional judgment. It can flag a supplier with declining on-time delivery rates, but it can’t tell you the contextual reason why (for example, a temporary regional logistics issue). Encourage users to use the data to ask better questions and to investigate anomalies. For any AI-driven or predictive insights you may add later, ensure there is always a clear path for human review and final decision-making, especially in strategic areas like vendor selection.
Your Next Steps to Gaining Procurement Visibility
Getting started with a procurement dashboard doesn’t require a massive, year-long project. The most successful initiatives begin with a small, focused effort that delivers tangible value quickly. This approach builds momentum and earns the buy-in needed for future expansion.
Here is a simple action plan to begin:
- Start a conversation. Schedule a 30-minute meeting with a leader from one business unit, such as Finance or IT. Ask them about their single biggest challenge related to spending or vendor management.
- Identify one key metric. Based on that conversation, identify one or two KPIs that would give them the visibility they are missing. If they are worried about software spend, the metric might be Unused License Count or Spend by Software Vendor.
- Map your data. Spend a few hours investigating where the data for that specific metric currently lives. Is it in the ERP? A spreadsheet? A vendor portal? Knowing the source is the first step to consolidating it.
By taking these small, deliberate steps, you can move procurement out of the black box and transform it into a strategic, data-driven function that supports the entire business.
Related Posts
Category:
Get a FREE
Proof of Concept
& Consultation
No Cost, No Commitment!