

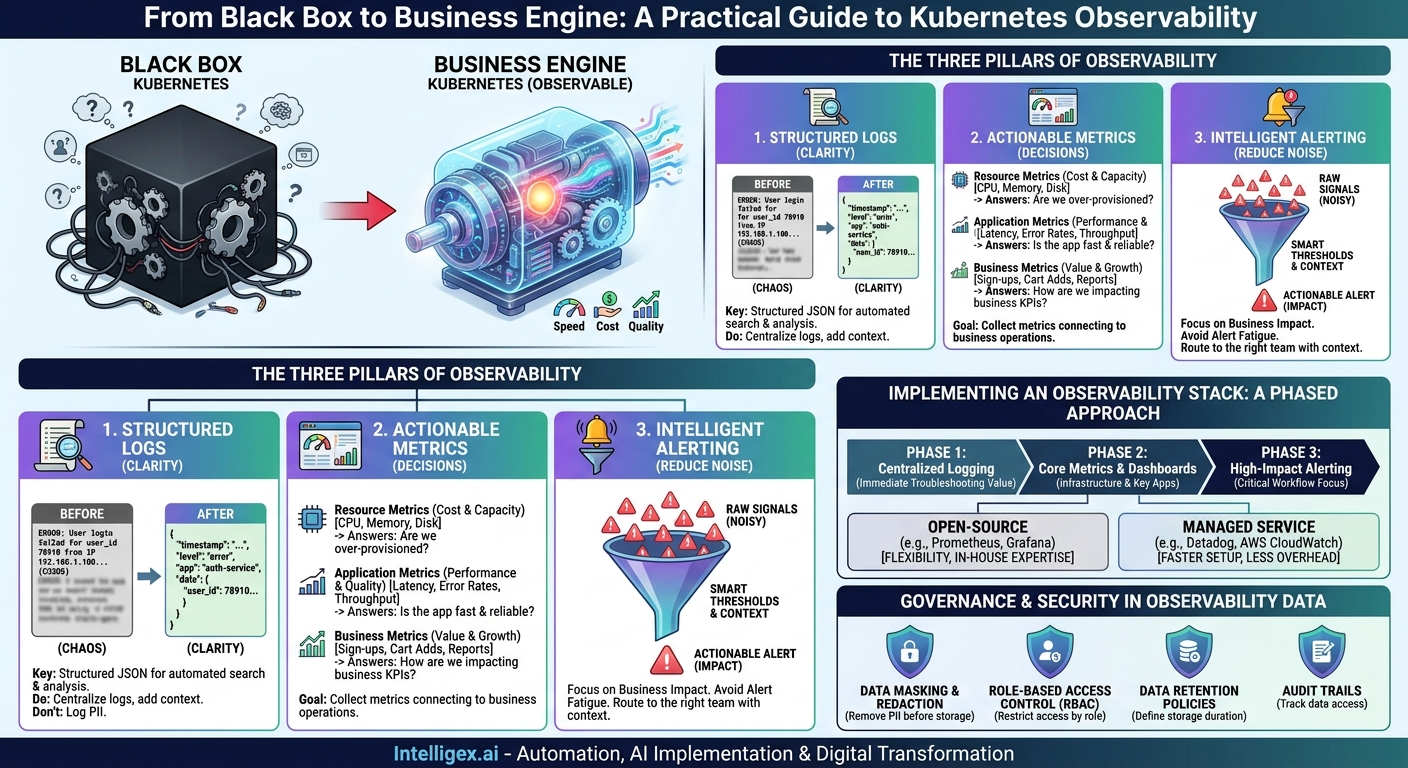
Your Kubernetes environment is the engine of your modern digital operations, running everything from your e-commerce platform to your internal financial reporting tools. But for many organizations, it’s a powerful engine locked inside a black box. When a customer-facing application slows down or a critical supply chain process fails, the pressure is on. Without visibility, teams waste valuable time guessing at the cause, leading to longer outages, frustrated customers, and rising operational costs.
This is where observability comes in. It’s more than just monitoring. It’s the ability to ask any question about your systems and get an answer, even questions you didn’t know you needed to ask. By effectively leveraging the three pillars of observability, logs, metrics, and alerts, you can transform Kubernetes from a complex black box into a transparent, resilient, and cost-effective foundation for your business.
Beyond Monitoring: Why Observability Drives Business Outcomes
Traditional monitoring was designed for a simpler time. It involved watching for known problems, like a server running out of disk space. Observability, on the other hand, is built for the dynamic and complex nature of modern systems like Kubernetes. It helps you explore the “unknown unknowns,” the unexpected issues that arise from the intricate interactions between dozens of microservices.
Connecting this technical capability to business results is straightforward. It directly impacts speed, cost, and quality.
- Speed to Resolution: When your sales team’s CRM integration fails, every minute of downtime impacts their ability to close deals. With a robust observability practice, your technical team can move from “the system is slow” to “the authentication service is experiencing 50% latency on requests from the Salesforce API” in minutes, not hours. This drastic reduction in Mean Time to Resolution (MTTR) gets critical business tools back online faster.
- Cost Optimization: Cloud resources are not free. Many Kubernetes workloads are over-provisioned, meaning you are paying for computing power you don’t actually use. By analyzing performance metrics, your finance and IT teams can identify a reporting service that uses 80% of its allocated memory only once a month during a batch job. The rest of the time, it sits idle. This data provides the justification to safely downsize the resources, directly reducing your monthly cloud bill.
- Service Quality and Customer Experience: Proactive problem-solving is the hallmark of a mature digital operation. Observability allows you to spot leading indicators of failure. For example, a logistics application might show a gradual increase in database query time. While not an outage yet, it’s a clear signal of a future problem. Addressing it proactively prevents a full-blown failure that could halt shipments and damage customer trust.
The First Pillar: Structuring Logs for Clarity, Not Chaos
Logs are the most fundamental piece of the observability puzzle. They are time-stamped records of events that happen within your applications and infrastructure. In Kubernetes, this is typically the output from your containers. However, a massive, unorganized stream of text is nearly useless. The key to unlocking their value is structure.
Unstructured logs are difficult to search, filter, and analyze automatically. Structured logs, typically in a format like JSON, turn each log entry into a piece of data with clear key-value pairs. This makes them machine-readable and infinitely more powerful.
Practical Steps for Better Logging
Adopting a structured logging practice is essential. Consider the difference:
Unstructured (Hard to Use):
ERROR: User login failed for user_id 78910 from IP 192.168.1.100 at 2023-10-28T14:30:00Z
Structured (Easy to Query):
{"timestamp": "2023-10-28T14:30:00Z", "level": "error", "message": "User login failed", "app": "auth-service", "data": {"user_id": 78910, "source_ip": "192.168.1.100"}}
With the structured version, an operations team can instantly run queries like, “Show me all error-level logs from the auth-service in the last hour,” or “Count the number of unique user IDs that experienced a login failure today.” This is impossible with the unstructured text.
Do’s and Don’ts for Logging
- Do: Centralize your logs. In a distributed system like Kubernetes, logs are scattered across many different containers and nodes. Use a log aggregator like Fluentd or Vector to collect them into a single, searchable location.
- Do: Add context to every log message. Include the application name, version, environment (production, staging), and a unique request ID. This allows you to trace a single user’s journey through multiple microservices.
- Don’t: Log sensitive personal or financial data (PII). This is a major security and compliance risk. Ensure all personally identifiable information, API keys, and passwords are scrubbed or masked before logs are stored.
The Second Pillar: Actionable Metrics That Drive Decisions
If logs tell you what happened, metrics tell you how your system is performing over time. Metrics are numerical measurements, like CPU utilization or application response time, collected at regular intervals. They are highly efficient to store and process, making them ideal for building dashboards and setting alerts.
The goal is not to collect every metric possible, but to collect the right ones that connect to business operations. A good starting point is to categorize metrics into a few key areas.
A Checklist of What to Measure
- Resource Metrics (Cost and Capacity): These are fundamental for infrastructure health and cost management.
- CPU and memory utilization
- Disk space and I/O rates
- Network bandwidth
Business Question Answered: Are we paying for more cloud infrastructure than we need? Do we have enough capacity for the upcoming holiday sales season?
- Application Metrics (Performance and Quality): These directly reflect the user experience.
- Request latency (e.g., API response time)
- Error rates (e.g., percentage of HTTP 500 errors)
- Throughput (e.g., requests per second)
Business Question Answered: Is our application fast and reliable for our customers? Are recent code changes improving or degrading performance?
- Business Metrics (Value and Growth): These are custom metrics instrumented directly in your code to track business KPIs.
- User sign-ups per hour
- Items added to cart
- Number of financial reports generated
Business Question Answered: How did our marketing campaign impact user activity? Is our new checkout flow leading to more completed purchases?
Tools like Prometheus have become the standard for collecting and storing metrics in the Kubernetes ecosystem. It integrates seamlessly with visualization tools that turn this raw data into intuitive dashboards for both technical and business stakeholders.
The Third Pillar: Intelligent Alerting to Reduce Noise and Fatigue
An alert is a notification that a system or business process requires attention. However, a poorly designed alerting strategy can be worse than none at all. If your team is bombarded with hundreds of low-priority, “flapping” alerts every day, they will quickly develop alert fatigue. This is a dangerous state where important, critical notifications get lost in the noise.
Intelligent alerting focuses on business impact. Instead of alerting when a single server’s CPU is high, you should alert when the customer checkout process is failing. The first is a potential cause; the second is a definite symptom with real business consequences.
A 5-Step Process for Creating a Meaningful Alert
- Define the Business Impact. Start by describing the user or business problem in plain language. For example, “Users cannot log into the mobile application.”
- Identify the Symptom Metric. Find the key performance indicator that directly signals this problem. In this case, it would be the “login API error rate.”
- Set a Smart Threshold. A single error is not a crisis. A good threshold is based on both magnitude and duration. For instance, “Alert when the login API error rate is above 3% for more than 5 minutes.”
- Route to the Right Team. Not every alert needs to wake up the entire engineering department. This mobile app login alert should go directly to the on-call engineer for the identity and authentication team.
- Provide Actionable Context. The alert message itself should be helpful. It should include what is broken, the level of impact, and a direct link to a dashboard or a runbook with troubleshooting steps. This saves critical time during an incident.
Implementing an Observability Stack: A Phased Approach
Adopting a full-scale observability platform can feel daunting. The best approach is to start small, prove value, and build incrementally. You also face a key decision: build with open-source tools or buy a managed commercial service.
A Phased Rollout
A typical journey starts with the basics and builds toward more advanced capabilities.
- Phase 1: Centralized Logging. The first and most critical step is to get all your logs into one place. This alone can dramatically reduce troubleshooting time.
- Phase 2: Core Metrics and Dashboards. Next, implement a metrics collection system like Prometheus and a visualization tool like Grafana. Start by building dashboards for basic infrastructure health and one or two critical applications.
- Phase 3: High-Impact Alerting. With logs and metrics in place, you can now build a few well-defined, symptom-based alerts for your most critical workflows.
Decision Point: Open Source vs. Managed Service
Open-Source Tools (like the Prometheus, Grafana, and Loki stack) offer maximum flexibility and have no direct licensing costs. However, they require significant in-house expertise to set up, manage, scale, and maintain. This is a good choice for organizations with a strong platform engineering team that needs deep customization.
Managed Services (from vendors like Datadog, New Relic, or cloud providers like Amazon Web Services with its CloudWatch suite) are much faster to implement and require far less operational overhead. You pay a subscription fee, which is often based on data volume. This is an excellent choice for teams that want to focus on their core business and get value from observability quickly, without building and managing the underlying infrastructure.
Governance and Security in Observability Data
Observability data is a powerful asset, but it can also contain sensitive information. As you collect more logs and metrics, establishing strong governance and security practices is not optional; it is a requirement for protecting your customers and your business.
Focus on a few key principles for safe implementation:
- Data Masking and Redaction: Before logs are even stored, they should pass through a process that automatically finds and removes or masks sensitive data. This includes names, email addresses, phone numbers, credit card details, and any other form of personally identifiable information (PII).
- Role-Based Access Control (RBAC): Different roles need different levels of access. A marketing analyst may need to see a dashboard of business KPIs, but they should not have access to raw production logs containing user session details. Implement strict access controls to ensure people can only see the data relevant to their job.
- Data Retention Policies: Storing data forever is a significant cost and a security liability. Define clear policies for how long you will keep different types of data, based on business needs and regulatory requirements like GDPR or CCPA. For instance, high-resolution metrics might be kept for 30 days, while aggregated daily reports are kept for a year.
- Audit Trails: Keep a record of who accessed what data and when. This is crucial for security investigations and for demonstrating compliance to auditors.
Next Steps: Building Your Observability Roadmap
Moving from theory to practice requires a deliberate plan. Taking a methodical, step-by-step approach ensures you build a sustainable observability practice that delivers real business value without overwhelming your teams.
- Assess Your Current Blind Spots. Start by talking to your teams. Ask your developers, operations engineers, and even your customer support leads: “What information do you wish you had when things go wrong?” Their answers will reveal the most painful gaps in your current visibility.
- Choose a High-Value Pilot Project. Don’t try to implement observability across the entire organization at once. Select a single, critical business application. A customer-facing API, an internal inventory management system, or a financial closing process are all excellent candidates. Success here will build momentum.
- Start with Centralized Logging. If you do nothing else, aggregate all the logs from your pilot application into a single, searchable system. This step alone often delivers the fastest and most significant improvement in troubleshooting time.
- Measure and Communicate the “Before and After.” Before you start, benchmark your current performance. How long does it typically take to resolve an issue for your pilot application? After implementing logging and basic metrics, measure that same process again. Use this concrete data (e.g., “We reduced resolution time for payment-processing errors by 60%”) to justify expanding the practice to other parts of the business.
By treating observability as a strategic business capability, not just a technical tool, you can unlock new levels of speed, efficiency, and reliability in your Kubernetes workflows, giving your organization a powerful competitive edge.
Your Next Read:
Category:
Get a FREE
Proof of Concept
& Consultation
No Cost, No Commitment!
