

Your business runs on data, but getting clear, timely answers can feel like an impossible task. Your finance team’s reports don’t match the sales team’s dashboard. Your marketing department wants to analyze customer behavior on your website, but that data lives in a separate system from your purchase history. The result is slow decisions, missed opportunities, and a constant debate over which numbers are the “right” numbers.
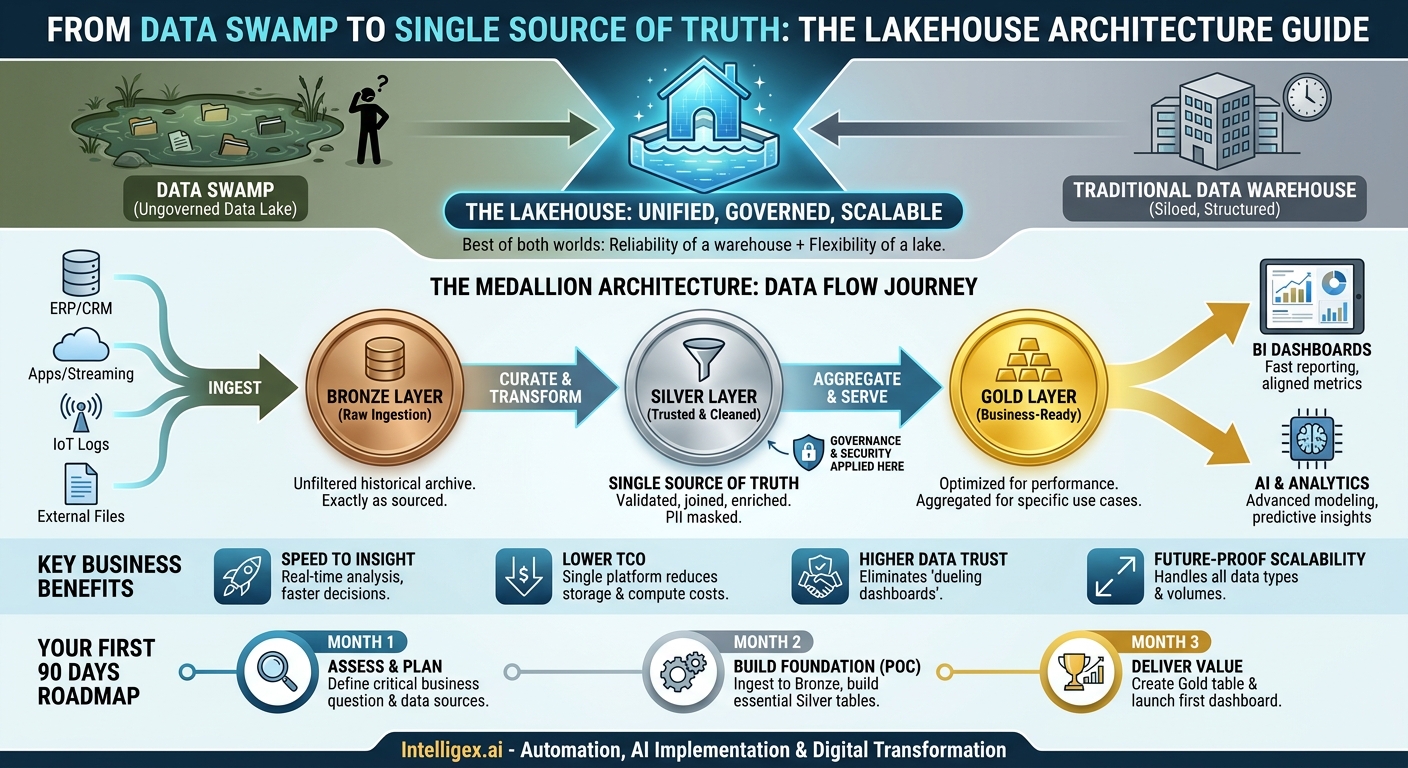
For years, businesses have been caught between two imperfect options. Data warehouses are great for structured, organized reports but struggle with the sheer volume and variety of modern data (like text, video, and sensor logs). Data lakes can store everything, but they often become messy, ungoverned “data swamps” where finding reliable information is a challenge. The lakehouse architecture is a modern approach designed to solve this problem, giving you a single, unified platform for all your data and analytics, from business intelligence (BI) dashboards to advanced AI models.
What Is a Lakehouse, Really? (And Why Should You Care?)
Imagine a single system that combines the reliability and performance of a data warehouse with the flexibility and scale of a data lake. That’s the core idea of a lakehouse. It allows you to store massive amounts of raw, unstructured data right alongside your clean, structured business data. This is made possible by a metadata layer that imposes structure and governance on the raw files stored in low-cost object storage.
But this isn’t just a technical upgrade. It directly translates to tangible business value.
- Speed to Insight: By eliminating the complex, brittle pipelines that move and copy data between separate lake and warehouse systems, your teams can get answers faster. An operations team can analyze real-time sensor data from a factory floor to predict equipment failure, without waiting for IT to process it overnight.
- Lower Total Cost of Ownership: A single system means less data duplication, fewer technologies to license and manage, and simpler infrastructure. You store one copy of the data and serve multiple use cases (BI, AI, data science) from that single source, significantly reducing storage and compute costs.
- Higher Data Quality and Trust: A lakehouse serves as a single source of truth. When the sales, marketing, and finance teams all pull from the same curated, governed data tables, their reports align. This ends the “dueling dashboards” debate and builds trust in the data across the organization.
- Future-Proof Scalability: Your business will generate more data tomorrow than it does today, and it will come in new formats. A lakehouse is built on scalable cloud storage, ready to handle everything from petabytes of transaction logs to high-resolution images and video feeds, ensuring your data strategy can grow with your business.
For example, a retail company can use a lakehouse to analyze structured sales data from its point-of-sale systems alongside unstructured social media comments and semi-structured website clickstream logs. This provides a complete picture of a marketing campaign’s effectiveness, from initial ad click to final purchase and post-sale customer sentiment, all within one system.
The Lakehouse Data Flow: A Step-by-Step Journey to Your BI Dashboard
To understand how a lakehouse works in practice, it’s helpful to follow the path data takes from its original source to a final BI dashboard. This journey is often organized using a “medallion architecture,” a simple model that represents data quality improving at each stage: Bronze, Silver, and Gold.
-
Step 1: Ingestion (The Bronze Layer)
The first step is to get data into the lakehouse. This raw, unfiltered data is loaded into the Bronze layer. Data is ingested from all kinds of sources: relational databases (like your ERP or CRM), streaming data from applications, logs from web servers, or files from third-party vendors. The key principle here is to capture the data exactly as it was at the source, creating a complete and auditable historical archive. You don’t filter or clean anything yet. This is your raw material.
-
Step 2: Curation and Transformation (The Silver Layer)
Once the raw data is in, the real work begins. Data is moved from the Bronze layer to the Silver layer, where it is cleaned, validated, and enriched. This is where you create a reliable single source of truth for your entire organization. Common tasks at this stage include:
- Removing duplicate records.
- Correcting data entry errors and standardizing formats (e.g., ensuring all dates are in the same format).
- Joining data from different sources, for instance, combining customer information from your CRM with their order history from your e-commerce platform.
- Masking or removing sensitive personally identifiable information (PII) to ensure privacy.
The tables in the Silver layer are what your data analysts and power users will query most often. They are clean, conformed, and trustworthy.
-
Step 3: Aggregation and Serving (The Gold Layer)
While the Silver layer is great for analysis, BI dashboards often need data in a very specific, aggregated format for fast performance. The Gold layer is where you create these final, business-ready tables. These are purpose-built datasets designed for specific use cases. For example, you might create a Gold table that summarizes sales by product, region, and day. This pre-calculated table allows an executive dashboard to load instantly, rather than forcing the BI tool to perform complex calculations every time someone opens it.
-
Step 4: Consumption (Powering BI and Analytics)
This is the final step where value is delivered. BI tools like Power BI, Tableau, or Looker connect directly to the Gold (and sometimes Silver) tables in the lakehouse. Because the lakehouse can serve data using standard SQL, these tools connect just as they would to a traditional data warehouse. The difference is that the data they are accessing is more comprehensive, timely, and directly linked to its raw source, providing complete visibility and lineage.
Real-World Scenarios: How Different Teams Win
The true power of a lakehouse is not just in its architecture, but in the new capabilities it unlocks for every department. By breaking down data silos, it empowers teams to answer more complex questions and collaborate more effectively.
Finance and Operations
A Chief Financial Officer wants a real-time view of profitability, but calculating the cost of goods sold (COGS) often requires data from multiple systems: raw material costs from procurement, shipping data from logistics, and labor costs from HR. In a traditional setup, this data is often reconciled only at the end of the month. With a lakehouse, data from all these sources can be ingested and joined in the Silver layer, providing a daily, or even hourly, view of COGS. This allows the business to react quickly to rising supply chain costs or production inefficiencies.
What to measure: Time to close the monthly books, variance in cost forecasting, inventory turnover.
Sales and Marketing
A marketing team wants to prove the ROI of their campaigns. This requires tracking the full customer journey, from the first ad they saw (data from Google Ads), to their activity on the website (clickstream data), to their eventual purchase (CRM data), and finally their feedback on social media (unstructured text data). A lakehouse can unify all this data into a “customer 360” view in the Silver layer. A Gold table can then be created to attribute revenue to specific campaigns, allowing the team to optimize ad spend and personalize customer outreach effectively.
What to measure: Customer acquisition cost (CAC), lifetime value (LTV), marketing attribution accuracy, churn rate.
Supply Chain and Manufacturing
A manufacturing company wants to reduce costly downtime from equipment failures. They can install IoT sensors on their machinery to stream real-time data (temperature, vibration, pressure) into the lakehouse. Data scientists can then analyze this streaming data alongside historical maintenance logs (structured data) and technician notes (unstructured text) to build predictive maintenance models. A Gold table can power a BI dashboard that alerts supervisors to a machine at high risk of failure, so maintenance can be scheduled proactively.
What to measure: Overall equipment effectiveness (OEE), mean time between failures (MTBF), maintenance costs.
Choosing Your Foundation: Key Lakehouse Platforms
The lakehouse market is evolving quickly, with several strong platforms to choose from. The right choice depends on your team’s existing skills, your cloud environment, and your primary goals (BI, AI, or both).
- Databricks: As the company that originally coined the term “lakehouse,” Databricks has built its platform on top of open-source technologies like Apache Spark, Delta Lake, and MLflow. It is known for its strong performance in large-scale data processing and its integrated environment for both data engineering and machine learning. You can learn more at https://www.databricks.com/.
- Snowflake: Originally a cloud data warehouse, Snowflake has expanded its platform to include many lakehouse capabilities. It allows you to store and query unstructured data in its “data cloud” and use tools like Snowpark to run Python and Java code directly on your data. It is often praised for its ease of use, separation of storage and compute, and strong BI workload performance. You can find more information at https://www.snowflake.com/.
- Cloud-Native Solutions: The major cloud providers offer their own services that you can assemble into a lakehouse architecture. For example, on Amazon Web Services, you might use Amazon S3 for storage, AWS Glue for data cataloging and transformation, and Amazon Redshift for querying the data. These solutions offer deep integration with their respective cloud ecosystems. You can explore the AWS documentation at https://docs.aws.amazon.com/.
The key decision point is not just about features. Consider what fits your team. If your team is heavy on SQL skills, a platform like Snowflake might offer a smoother transition. If your organization is building advanced AI applications and has strong Python and Spark expertise, Databricks could be a better fit.
Governance and Security: Using Your Data Safely
A single platform containing all your company’s data is incredibly powerful, but it also introduces critical responsibilities for security and governance. A well-designed lakehouse builds these protections in from the start, ensuring you can innovate without compromising sensitive information.
Fine-Grained Access Control is fundamental. Not everyone in the company should see everything. Using role-based access control (RBAC), you can define precise permissions. For example, an HR analyst can be granted access to aggregated, anonymized employee retention statistics in a Gold table but be blocked from seeing the raw, sensitive PII in the Silver or Bronze tables. This ensures data is used only for its intended purpose.
Data Privacy and Masking must be automated. When ingesting customer data, you should have processes that automatically identify and mask PII like names, email addresses, and phone numbers in the Silver layer. This allows analysts to work with rich datasets to understand trends without exposing individual customer details, helping you comply with regulations like GDPR and CCPA.
Auditability and Lineage are key benefits. Modern lakehouse formats, like Delta Lake, automatically version every change made to your data. If a discrepancy appears in a report, you can trace the data’s entire lineage back to its raw source, seeing who changed what and when. This transparency is crucial for debugging data quality issues and satisfying compliance auditors.
Finally, when using lakehouse data for AI, a Human-in-the-Loop approach is essential. An AI model trained to predict customer churn should be reviewed and validated by business experts before it’s put into production. They can ensure the model’s logic is sound and doesn’t perpetuate unintended biases, maintaining a critical layer of human oversight.
Common Pitfalls and How to Avoid Them
Migrating to a lakehouse architecture is a significant undertaking, and several common mistakes can derail a project. Being aware of them upfront can help you plan for a smoother implementation.
A primary pitfall is treating the lakehouse like a data swamp. Without the discipline of a structured approach like the medallion architecture, it’s easy to end up with a disorganized collection of files that is just as difficult to use as a legacy data lake. Another mistake is neglecting governance until it’s too late. Trying to bolt on security and access controls after the fact is far more complex and less effective than building them in from day one.
To set your project up for success, follow this simple checklist:
- Define business use cases first. Don’t start with technology. Start by identifying a specific, high-value business problem you want to solve. This will guide your design and help you demonstrate a quick win.
- Establish data ownership early. For every critical dataset, assign a clear owner or steward who is responsible for its quality, definition, and appropriate use.
- Start with a small proof of concept. Choose one business area and one dataset. Build out the full Bronze-Silver-Gold pipeline for that single use case to learn the process and show tangible value to stakeholders.
– Plan for data quality monitoring. Implement automated checks and alerts at each stage of the data flow to catch issues before they impact your BI dashboards.
Getting Started: Your First 90 Days
Adopting a lakehouse is a journey, not a flip of a switch. A phased approach focused on delivering incremental value is the most effective way to build momentum and achieve long-term success. Here is a practical roadmap for your first three months.
Month 1: Assess and Plan
The first 30 days are about discovery and strategy. Identify one to two critical business questions that are currently difficult to answer. Perhaps it’s understanding customer churn or getting a real-time view of inventory. Inventory the data sources you would need to answer these questions and assess your team’s current data skills. This initial phase provides the blueprint for your pilot project.
Month 2: Build the Foundation (Proof of Concept)
With a clear use case in mind, it’s time to get hands-on. Select a lakehouse platform for a proof of concept. Focus on ingesting the necessary data for your chosen problem into the Bronze layer. Then, build one or two essential Silver tables by cleaning and joining the raw data. The goal here is not perfection, but progress. You want to create a functional, foundational dataset that is ready for analysis.
Month 3: Deliver Initial Value
In the final month of the initial phase, the focus shifts to delivering a tangible outcome. Create a targeted Gold table from your Silver data, designed specifically for your use case. Connect a BI tool to this table and build a simple, clear dashboard that answers the business question you identified in month one. Share this dashboard with key stakeholders. This first deliverable, however small, demonstrates the power of the new architecture and builds the organizational support needed for a broader rollout.
Your Next Read:
Category:
Get a FREE
Proof of Concept
& Consultation
No Cost, No Commitment!