

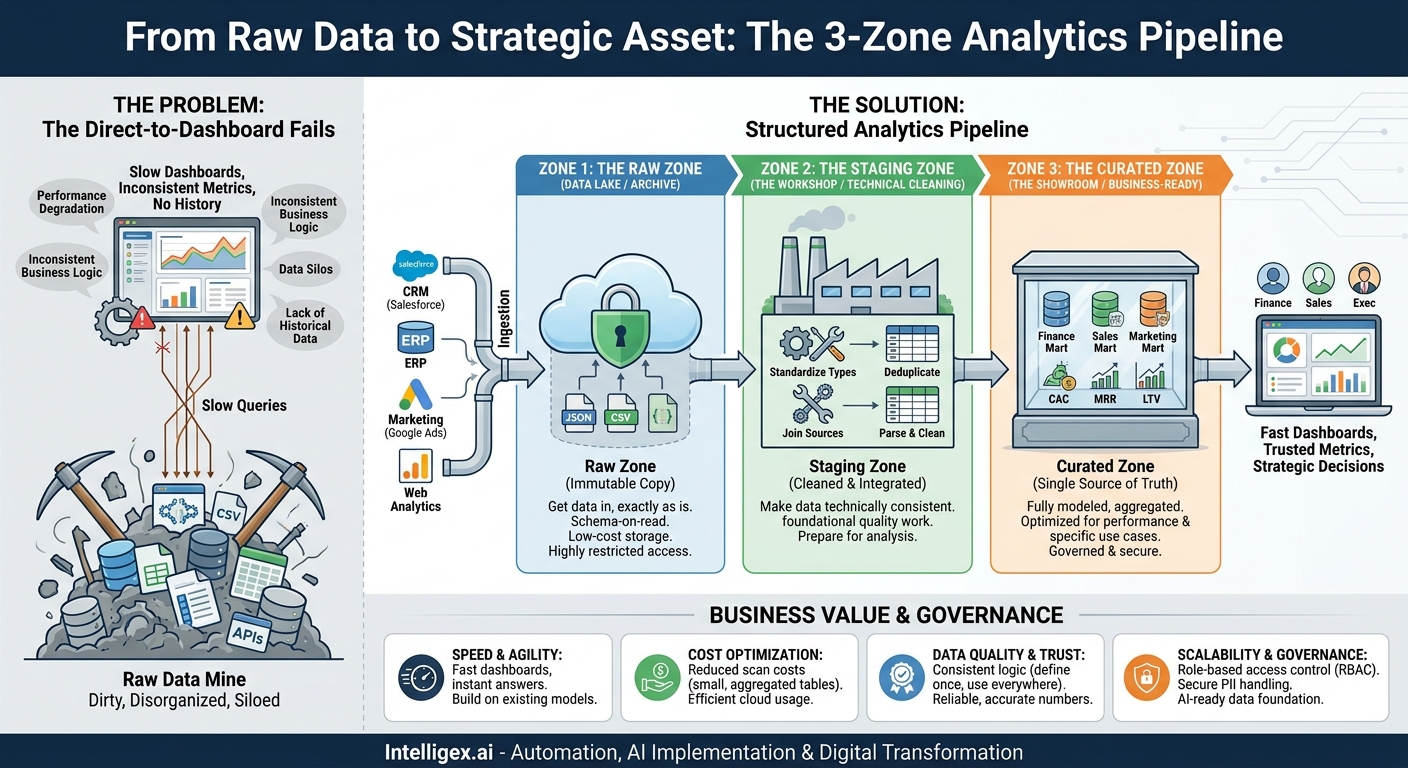
Most organizations are sitting on a goldmine of data. The challenge is that it’s less like a vault of gold bars and more like an actual mine: dirty, disorganized, and difficult to extract value from. The common reflex is to connect business intelligence (BI) tools directly to raw operational systems. This leads to slow dashboards, inconsistent metrics, and a constant, frustrating cycle of data fire drills. When the sales team’s revenue number doesn’t match the finance team’s, everyone loses trust in the data.
The problem isn’t the data itself. It’s the absence of a system to refine it. A structured analytics pipeline is the critical infrastructure that turns raw, messy data into a reliable, strategic asset. By systematically moving data through three distinct zones (Raw, Staging, and Curated), you create a foundation for speed, quality, and scale. This approach transforms data from a chaotic liability into the fuel for every major business decision.
Why the “Direct-to-Dashboard” Model Fails
Connecting a BI tool like Power BI or Tableau directly to a production database like your Salesforce instance or ERP system seems like the fastest path to insight. In reality, it’s a shortcut that creates long-term technical debt and undermines business confidence. This direct approach is brittle, inefficient, and unscalable.
Consider these common failure points:
- Performance Degradation: Running complex analytical queries directly against an operational database can slow it down dramatically. This impacts the customer-facing or employee-facing application it supports. Your sales team will notice if their CRM becomes sluggish every time an executive refreshes a dashboard.
- Inconsistent Business Logic: If five different analysts build five different reports, they will likely define “active customer” or “net revenue” in five slightly different ways. This logic is hidden within each individual report. There is no single source of truth, leading to conflicting numbers and endless reconciliation meetings.
- Lack of Historical Data: Operational systems are often designed to hold current state, not a complete history. If a customer record is updated or deleted, the old information may be gone forever. Without a system to capture and preserve this history, you can never analyze trends over time accurately.
- Data Silos: A single report can rarely answer a complex business question. To understand customer lifetime value, you need data from your CRM, your payment processor, and your marketing platform. A direct-to-dashboard approach makes joining these disparate sources incredibly complex and often requires manual, error-prone work in spreadsheets.
This method doesn’t scale. As you add more data sources, more users, and more questions, the entire system grinds to a halt. The solution is to stop treating data analysis like a one-step process and start building a proper, multi-stage pipeline.
The Three Zones: Raw, Staging, and Curated
A modern analytics pipeline organizes data flow into three logical zones. Each zone has a distinct purpose, transforming the data from its original, untouched state into a polished, business-ready asset. Think of it as refining crude oil into gasoline. You don’t pump crude oil directly into your car; it must go through specific refinement stages first.
Zone 1: The Raw Zone (The Data Lake)
The first stop for your data is the Raw Zone, often implemented as a data lake using low-cost cloud storage like Amazon S3 or Azure Blob Storage. The guiding principle here is simple: get the data in, exactly as it is, without any changes.
- What it is: An exact, immutable copy of the source data. If it’s a daily CSV export from a partner, you store the CSV. If it’s a JSON payload from an API, you store the JSON.
- Why it matters: This zone is your ultimate historical archive and safety net. Since the data is unaltered, you can always replay your entire pipeline if you discover a bug in your logic or need to answer a new question with historical context. It decouples your analytics work from the source systems, so you never need to ask a source system for the same data twice.
- Key characteristics: Low-cost storage, schema-on-read (you don’t define the structure until you query it), and highly restricted access, typically limited to data engineers.
Zone 2: The Staging Zone (The Workshop)
Once data is safely landed in the Raw Zone, it moves to Staging. This is the workshop where the data is cleaned, standardized, and combined. The goal is not to apply business logic yet, but to make the data technically consistent and usable for developers and analysts.
- What it is: A collection of tables where raw data has been parsed, cleaned, and integrated.
- Why it matters: It’s where the foundational data quality work happens. Inconsistent data types, duplicate entries, and differing formats across systems are resolved here. This zone provides a reliable, cleaned foundation for all future analysis, saving countless hours of repetitive cleaning work down the line.
- Common tasks:
- Casting data to correct types (e.g., converting a text field ‘2023-11-21’ to a proper date).
- Standardizing categorical values (e.g., mapping ‘USA’, ‘U.S.A.’, and ‘United States’ to a single ‘US’).
- Deduplicating records.
- Joining data from different sources into wider tables (e.g., combining customer information from your CRM with transaction data from your payment system).
Zone 3: The Curated Zone (The Showroom)
The final stop is the Curated Zone, sometimes called the Gold or Presentation layer. This data is fully modeled, aggregated, and optimized for specific business use cases. It represents the “single source of truth” for key business metrics and dimensions.
- What it is: A set of clean, easy-to-understand data models (often called data marts) tailored for departments like Sales, Finance, or Marketing.
- Why it matters: This is what end-users interact with. The tables are small, fast, and intuitive. A finance analyst doesn’t need to know how to join 15 different tables to calculate Monthly Recurring Revenue (MRR); they can simply query the `finance_mrr_summary` table where that logic is already perfectly encoded. This dramatically accelerates the speed to insight and builds trust in the numbers.
- Key characteristics: Optimized for query performance, contains clear business definitions, and is governed by strict access controls to ensure teams only see the data relevant to them.
Connecting the Pipeline to Tangible Business Value
Implementing this structure isn’t just a technical exercise. It directly impacts your bottom line by improving speed, reducing costs, and increasing the quality of your decisions.
Speed and Agility
With a curated layer, business users get answers in seconds, not days. Dashboards load instantly because they query small, aggregated tables. When a new business question arises, analysts can often answer it by combining existing curated models, rather than starting from scratch with raw data. This agility allows you to react to market changes faster.
Cost Optimization
Cloud data warehouses charge based on the amount of data scanned during a query. Running queries against massive, raw JSON files is expensive. By transforming and aggregating data in the Curated Zone, the tables become much smaller. A query that might scan terabytes in the Raw Zone may only scan a few megabytes in the Curated Zone, leading to significant cost savings on your cloud bill.
Data Quality and Trust
By centralizing business logic in the transformation from Staging to Curated, you ensure consistency. The definition for “net revenue” is coded once and used everywhere. When the leadership team looks at a dashboard, they can trust the numbers are the same ones used by the finance and sales teams. This trust is the bedrock of a data-driven culture.
Scalability and Governance
This layered architecture is built to scale. As you add new data sources, you simply land them in the Raw Zone and integrate them in Staging without disrupting existing curated models. It also makes governance easier. You can set permissions at the zone or even the table level, ensuring that sensitive HR data is only accessible to the HR team, while marketing analytics are available to the marketing department.
A Step-by-Step Guide to Building Your First Pipeline
The idea of an enterprise-wide pipeline can be intimidating. The key is to start small with a single, high-value business problem. Let’s walk through building a pipeline to answer: “What is the true cost of customer acquisition (CAC) per marketing channel?”
- Define the Curated Output First: Start with the end in mind. The business needs a simple table, let’s call it `monthly_channel_performance`. It should have columns like `month`, `channel_name`, `total_marketing_spend`, `new_customers_acquired`, and the calculated metric `customer_acquisition_cost`.
- Identify Raw Data Sources: To build this table, you’ll need data from multiple systems.
- Marketing Spend: Exports from Google Ads, LinkedIn Ads, and other ad platforms (likely CSVs or API data).
- Customer Conversions: Data from your CRM, like Salesforce, showing when a lead became a customer (API data).
- Channel Attribution: Web analytics data (e.g., Google Analytics) to connect a new customer to their original marketing channel (API data).
- Plan the Raw Ingestion: Set up simple, automated jobs to copy the data from these sources into your data lake (e.g., an AWS S3 bucket). Do not transform it. The Google Ads data lands as is, the Salesforce data lands as is. Schedule this to run daily or hourly.
- Design the Staging Transformations: Now, plan the cleaning. This is where you create staging tables.
- Create a `stg_spend` table that unifies the different spend formats from Google and LinkedIn into a single table with standardized columns: `date`, `channel`, `spend_amount`.
- Create a `stg_customers` table from the Salesforce data, cleaning up lead source information and isolating the exact date each customer converted.
- Build the Curated Logic: This is where the core business logic lives. Write a single query or transformation script that joins `stg_spend` and `stg_customers`. It will aggregate the data by month and channel to calculate the total spend and total new customers, then divide one by the other to produce your `customer_acquisition_cost` metric. This final, clean table is your `monthly_channel_performance` model. You can use a tool like dbt (Data Build Tool) to manage this logic effectively.
- Connect and Visualize: Finally, connect your BI tool, such as Microsoft Power BI, to only the `monthly_channel_performance` table in the Curated Zone. The dashboard will be fast, the logic will be transparent, and the metric will be trustworthy.
Common Pitfalls to Avoid
As you build out your analytics pipeline, be mindful of these common traps. Avoiding them will save significant time and resources.
- Don’t Do Transformations in the Raw Zone. The purpose of the Raw Zone is to be a perfect, untouched backup of the source. Cleansing or altering data here defeats that purpose and can prevent you from being able to reprocess data if your logic needs to change. Do: Keep it immutable.
- Don’t Put Complex Business Logic in the Staging Zone. The Staging Zone is for technical cleaning: standardizing data types, joining keys, and deduplicating. Defining what counts as “revenue” or an “active user” is business logic. Do: Keep that logic in the transformation between Staging and Curated, where it’s visible and well-documented.
- Don’t Build a Single, Giant Curated Table. It’s tempting to create one massive table with hundreds of columns to answer every possible question. This becomes slow, confusing, and impossible to maintain. Do: Build smaller, purpose-built curated models for specific business domains (e.g., finance, marketing, product).
- Don’t Forget to Monitor for Data Quality. Data sources can change without warning. An API can add a new field, or a team can change how they input data. Do: Implement automated tests to check for freshness, null values, and unexpected changes in your data at each stage of the pipeline.
Governance and Security: Preparing for AI and Beyond
A well-structured pipeline is also a prerequisite for responsible data governance and the safe implementation of AI. By design, the three-zone architecture gives you precise control over your data.
Role-Based Access Control
The separation of zones allows you to implement strict access controls.
- Raw Zone: Access is limited to a small number of data engineers and service accounts responsible for ingestion.
- Staging Zone: Access can be granted to data analysts and scientists who need to do exploratory analysis on cleaned data.
- Curated Zone: Access can be granted widely to business users, but on a need-to-know basis. The finance team gets access to finance models, and the sales team gets access to sales models.
This layered security model ensures sensitive data is protected while democratizing access to business-ready insights.
Handling Sensitive Data and PII
The pipeline provides a clear, controllable process for managing Personally Identifiable Information (PII). PII can be ingested into the highly-restricted Raw Zone. Then, during the transformation to the Staging or Curated zones, you can apply anonymization, tokenization, or masking techniques. This ensures that analysts and business users in the Curated Zone can work with valuable aggregated data without ever being exposed to sensitive, individual-level information, helping you comply with regulations like GDPR and CCPA.
A Solid Foundation for AI
You cannot build a reliable AI model on chaotic data. The infamous “garbage in, garbage out” problem is the single biggest reason AI initiatives fail. Your Curated Zone is the perfect source for machine learning. It provides clean, structured, and trustworthy “feature sets” to train predictive models. Whether you’re building a customer churn prediction model or a sales forecasting tool, starting with curated data dramatically increases your chances of success and reduces the risk of biased or inaccurate AI outputs.
Your Next Steps to Building a Data-Driven Culture
An analytics pipeline isn’t a one-time project; it’s a foundational capability. It’s the factory floor that consistently produces one of your most valuable assets: trusted information. By moving from a chaotic direct-to-dashboard approach to a structured Raw, Staging, and Curated model, you build a system that delivers speed, quality, and scale.
The path forward doesn’t require a massive, multi-year overhaul. It starts with one well-defined business problem.
- Identify one pain point: Find one report that is always slow, always wrong, or always debated.
- Map the data journey: Trace the data from its source systems to the final number.
- Build your first pipeline: Apply the Raw → Staging → Curated pattern to this single use case.
By delivering tangible value on a small scale, you build momentum and demonstrate the power of a systematic approach. This is the first and most critical step in transforming your organization into a truly data-driven powerhouse.
Your Next Read:
Category:
Get a FREE
Proof of Concept
& Consultation
No Cost, No Commitment!
