

Your Databricks jobs are the engines of your data strategy. They transform raw data into financial reports, power customer-facing AI features, and refresh the sales dashboards your leadership team relies on every morning. When a job fails, the impact is immediate and obvious. But what about the jobs that don’t fail? The ones that silently run too slowly, consume too much budget, or process incomplete data. These subtle issues can be far more damaging, leading to slow decisions, eroded trust in data, and spiraling cloud costs.
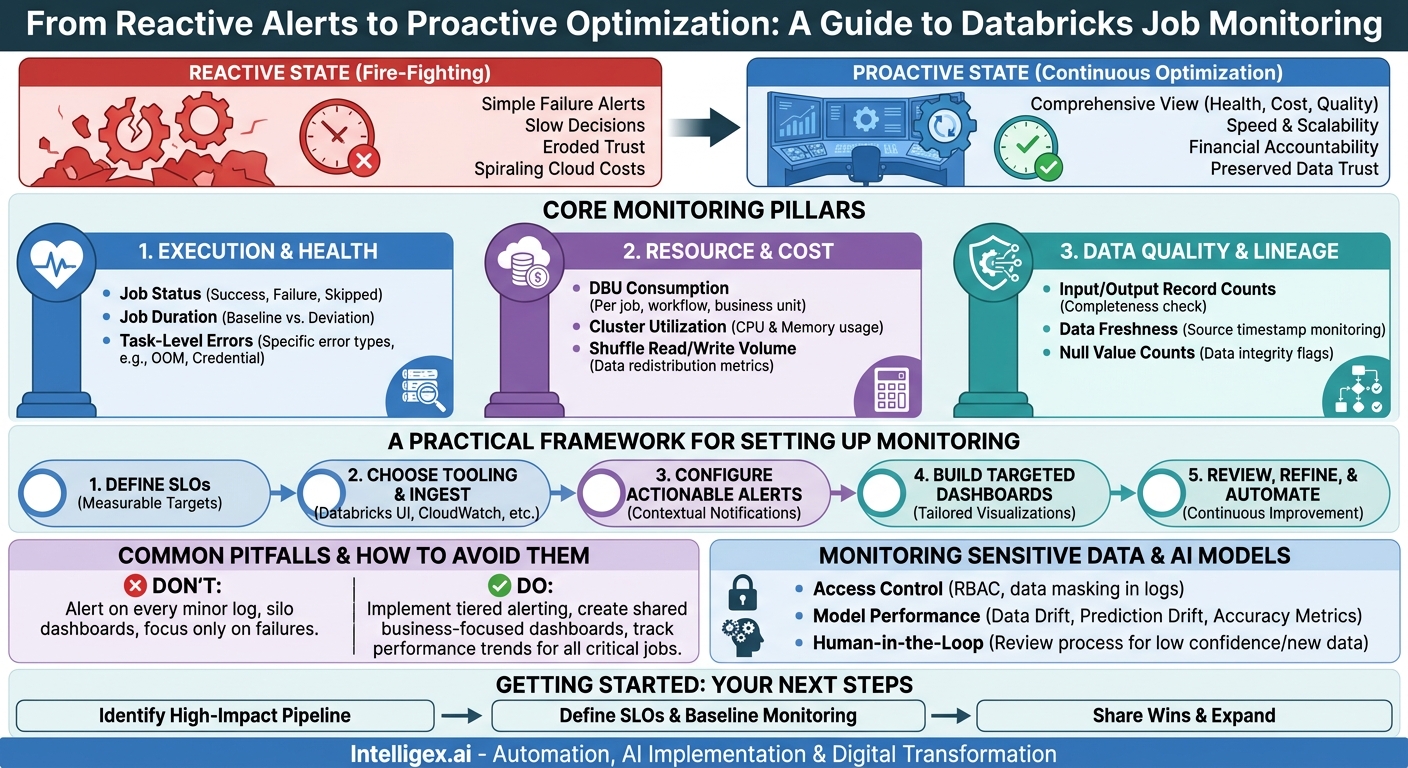
Effective Databricks job monitoring moves beyond simple failure alerts. It provides a comprehensive view into the health, cost, and quality of your data pipelines. This visibility is not just a technical nice-to-have. It is a business necessity that directly impacts your organization’s speed, scalability, and bottom line. By tracking the right metrics, you can shift from a reactive, fire-fighting mode to a proactive state of continuous optimization.
Why Proactive Monitoring Matters (Beyond “It Failed”)
Imagine your most critical sales pipeline finishes three hours late. The leadership team is looking at stale data during their morning meeting, making decisions based on outdated information. Or consider a machine learning job that quietly starts costing 50% more to run due to an inefficient data transformation. Without proactive monitoring, these problems might go unnoticed for weeks, wasting budget and undermining business initiatives.
A mature monitoring strategy provides clear business value across several key areas:
- Cost Management: Proactively identify and fix inefficient jobs that waste expensive compute resources. By tracking Databricks Units (DBUs) per job, you can attribute costs directly to specific teams or projects, creating a culture of financial accountability.
- Operational Speed: Ensure data is delivered on time, every time. Monitoring job duration and performance helps you meet Service Level Agreements (SLAs) and guarantees that decision-makers have fresh data when they need it.
- Data Quality and Trust: Catch data integrity issues at the source. By monitoring record counts and data freshness, you can prevent bad data from polluting downstream systems, dashboards, and machine learning models, thereby preserving trust in your analytics.
- Scalability and Performance: As your data volume grows, inefficient jobs become major bottlenecks. Monitoring helps you pinpoint performance issues, optimize code, and ensure your data architecture can scale effectively to meet future demands.
Core Monitoring Pillars: What Every Team Should Track
A robust monitoring strategy is built on three distinct but interconnected pillars. Focusing on metrics from each category provides a holistic view of your pipeline’s health, moving far beyond a simple success or failure status.
1. Execution and Health Metrics
These are the foundational metrics that tell you if your jobs are running as expected. They are your first line of defense against outright failures and performance degradation.
- Job Status (Success, Failure, Skipped): The most basic signal. A sudden spike in failures is an obvious red flag that requires immediate investigation.
- Job Duration: How long does a job take to run? You should establish a baseline for your critical jobs. A significant deviation from this baseline, even if the job succeeds, indicates a potential problem like increased data volume, an upstream bottleneck, or inefficient code.
- Task-Level Errors: When a job fails, the specific error message is crucial for a quick resolution. Is it an “Out of Memory” (OOM) error, a problem with reading a source file, or a credential issue? Capturing and categorizing these errors helps your team identify recurring patterns.
Business Scenario: A finance department’s end-of-quarter reporting job normally takes 45 minutes. One day, it runs for four hours but still “succeeds.” Because the team monitors job duration, they receive an alert about the anomaly. They investigate and discover that a new data source was added without a proper partitioning strategy, causing a massive performance bottleneck. They fix the issue before the next run, ensuring the CFO’s report is delivered on time.
2. Resource and Cost Metrics
In a consumption-based platform like Databricks, performance is directly tied to cost. Inefficient jobs not only run slowly but also burn through your budget. Tracking resource usage is essential for running a cost-effective data platform.
- DBU Consumption: The Databricks Unit (DBU) is the primary unit of processing cost. You must track DBU usage per job, per workflow, and ideally, per business unit. This allows you to identify the most expensive parts of your data platform and prioritize optimization efforts.
- Cluster Utilization (CPU and Memory): Are your clusters right-sized? A cluster that consistently shows 95% CPU utilization may be a bottleneck, while one that hovers at 20% is likely over-provisioned and wasting money. Monitoring utilization helps you fine-tune your cluster configurations.
- Shuffle Read/Write Volume: In Spark, “shuffling” is the process of redistributing data across partitions, and it is often a major performance killer. High shuffle metrics can point to inefficient joins or aggregations in your code. Reducing shuffle I/O almost always leads to faster and cheaper jobs.
Business Scenario: An IT operations team notices that the company’s monthly cloud bill has increased by 15%. By analyzing DBU consumption per job, they pinpoint a single marketing analytics job as the culprit. The job was creating a massive cross-join, leading to excessive data shuffling. After rewriting the logic to be more efficient, the job’s DBU consumption dropped by 70%, bringing the cloud bill back in line.
3. Data Quality and Lineage Metrics
A job can run successfully, on time, and within budget, but still be a complete failure if it processes bad data. Data quality metrics ensure the output of your pipelines is accurate and reliable.
- Input/Output Record Counts: A simple but powerful check. If your daily ingestion job normally processes 10 million rows but suddenly processes only 1,000, something is wrong with the upstream source, even if your job didn’t fail. This check prevents incomplete data from propagating downstream.
- Data Freshness: How old is the data you are processing? If the source data for your sales forecast hasn’t been updated in three days, your model’s output will be useless. Monitoring the timestamp of source files is critical.
- Null Value Counts: A sudden increase in null values in a key column (like `customer_id` or `transaction_amount`) is a major data quality red flag. This can signal issues in data collection or an upstream transformation.
Business Scenario: A logistics company uses a Databricks job to optimize delivery routes based on incoming order data. A data quality check is implemented to monitor the number of orders with a valid, non-null delivery address. One day, the check triggers an alert: 30% of incoming orders have a null address. The job is automatically paused, preventing thousands of un-routable orders from being sent to the planning system. An upstream application bug is found and fixed, and only then is the pipeline resumed.
A Practical Framework for Setting Up Monitoring
Getting started with monitoring doesn’t require a massive, all-at-once effort. By following a structured approach, you can build a robust monitoring practice incrementally.
- Define Your Service Level Objectives (SLOs): Before you measure anything, define what “good” looks like. An SLO is a specific, measurable target for your pipeline’s performance. Collaborate with business stakeholders to set these goals. Examples include: “The daily executive dashboard data must be refreshed by 8:00 AM Eastern Time with 99% reliability,” or “The DBU cost for the HR analytics workspace must not exceed X per month.”
- Choose Your Tooling and Ingest Metrics: Start with the tools you already have. The Databricks UI, cluster event logs, and query history are rich sources of information. For more advanced needs, you can export this data to external observability platforms. Many organizations leverage native cloud monitoring services like Amazon CloudWatch or Azure Monitor to centralize logs and metrics from Databricks alongside their other applications. You can find extensive official documentation from cloud providers like AWS on how to set up these integrations.
- Configure Actionable Alerts: Raw metrics are not enough. You need automated alerts to notify the right people when an SLO is breached or an anomaly is detected. The key is to make alerts actionable. An alert stating “Job 123 Failed” is less helpful than one that says “Finance Reporting Job Failed: S3 Source File Not Found. SLO for 8:00 AM data delivery is at risk.”
- Build Targeted Dashboards: Visualize your metrics in dashboards tailored to different audiences. An engineering team needs a detailed dashboard with Spark metrics and error logs. A business leader, on the other hand, needs a high-level dashboard showing data freshness, pipeline latency, and overall cost trends. Visualizations make it easy to spot trends that might be missed in raw logs.
- Review, Refine, and Automate: Monitoring is a continuous process. Hold regular reviews (e.g., weekly or bi-weekly) to analyze alerts, discuss performance trends, and identify opportunities for optimization. Use these insights to refine your code, adjust cluster configurations, and improve your alerting rules over time.
Common Pitfalls and How to Avoid Them
As you build out your monitoring strategy, be mindful of common traps that can undermine its effectiveness. Focusing on best practices from the start will save you significant time and effort down the road.
- Don’t: Create alerts for every minor warning or log entry. This quickly leads to “alert fatigue,” where your team begins to ignore notifications, including the critical ones.
- Do: Implement a tiered alerting strategy. Use different channels or priority levels for different types of events. A critical job failure might trigger a PagerDuty alert, while a minor performance degradation might post a message in a team’s Slack channel.
- Don’t: Keep monitoring dashboards and metrics locked within the engineering team. This creates a silo and disconnects technical performance from business impact.
- Do: Create shared dashboards and communicate in business terms. Instead of a chart titled “Shuffle Write Bytes,” create one called “Daily Sales Report Generation Time.” This helps business stakeholders understand the value of your work.
- Don’t: Only focus on jobs that fail. A “successful” job can still be incredibly inefficient, costly, or produce low-quality data.
- Do: Track performance and cost metrics for all critical jobs. Pay close attention to trends. A job whose duration creeps up by 5% every week is a ticking time bomb that needs to be addressed.
Monitoring Jobs with Sensitive Data and AI Models
When your Databricks jobs process sensitive information (like Personally Identifiable Information, or PII) or power AI models, your monitoring responsibilities expand. It’s not just about operational health anymore; it’s about governance, security, and trust.
First, consider access control. Your monitoring logs and dashboards can inadvertently expose sensitive data. Error messages might contain sample data, or query history could reveal access patterns. Implement strict role-based access control (RBAC) to ensure that only authorized personnel can view detailed logs. Where possible, configure your logging to automatically mask or scrub sensitive data fields before they are stored.
For AI and machine learning workloads, monitoring must go a step further. In addition to tracking the job’s execution health, you need to monitor the model’s performance itself. This includes:
- Data Drift: Is the new, live data the model is seeing significantly different from the data it was trained on? Monitoring the statistical distribution of input features can detect this.
- Prediction Drift: Is the distribution of the model’s output changing over time? A sudden shift in predictions could indicate a problem.
- Accuracy and Performance Metrics: How accurate is the model? For critical models, you should continuously track metrics like precision, recall, or business-specific KPIs against a baseline.
Finally, incorporate a human review process. For high-stakes decisions driven by AI, such as fraud detection or medical diagnostics, your monitoring system should do more than just send an alert. It should trigger a workflow for human review whenever the model’s confidence is low or it encounters a type of data it has never seen before. This human-in-the-loop approach is a crucial component of responsible AI implementation.
Getting Started: Your Next Steps
Implementing a comprehensive monitoring strategy can feel daunting, but the key is to start small and demonstrate value quickly. Don’t try to monitor every job in your environment on day one. Instead, follow an iterative, value-driven approach.
First, identify a single, high-impact data pipeline. This could be the workflow that generates your most important financial report, powers a customer-facing application, or feeds the primary sales dashboard. Work with the business owners of that pipeline to define its SLOs for timeliness, cost, and data quality.
Next, implement baseline monitoring for just that one pipeline. Use Databricks’ built-in tools to track its core health and cost metrics. Set up a few key alerts for SLO breaches. Within a few weeks, you will have concrete data showing its performance trends and potential areas for improvement.
Share these initial findings with your stakeholders. Show them how monitoring provided new visibility, perhaps by identifying an optimization that saved 20% on the job’s cost or by catching a data quality issue before it impacted a report. This early win builds momentum and secures the buy-in needed to expand your monitoring practice across other critical areas of the business. By taking these deliberate steps, you can transform monitoring from a technical chore into a strategic capability that drives efficiency, trust, and business value.
Your Next Read:
Category:
Get a FREE
Proof of Concept
& Consultation
No Cost, No Commitment!
