

Every organization wants to be data-driven. We invest in powerful analytics platforms, hire talented analysts, and task our teams with finding insights that will move the needle. But there’s a quiet, persistent problem lurking beneath the surface of our dashboards and reports: the quality of the data itself. Making a decision based on flawed data is often worse than relying on intuition alone. It gives us a false sense of confidence while leading us in the wrong direction.
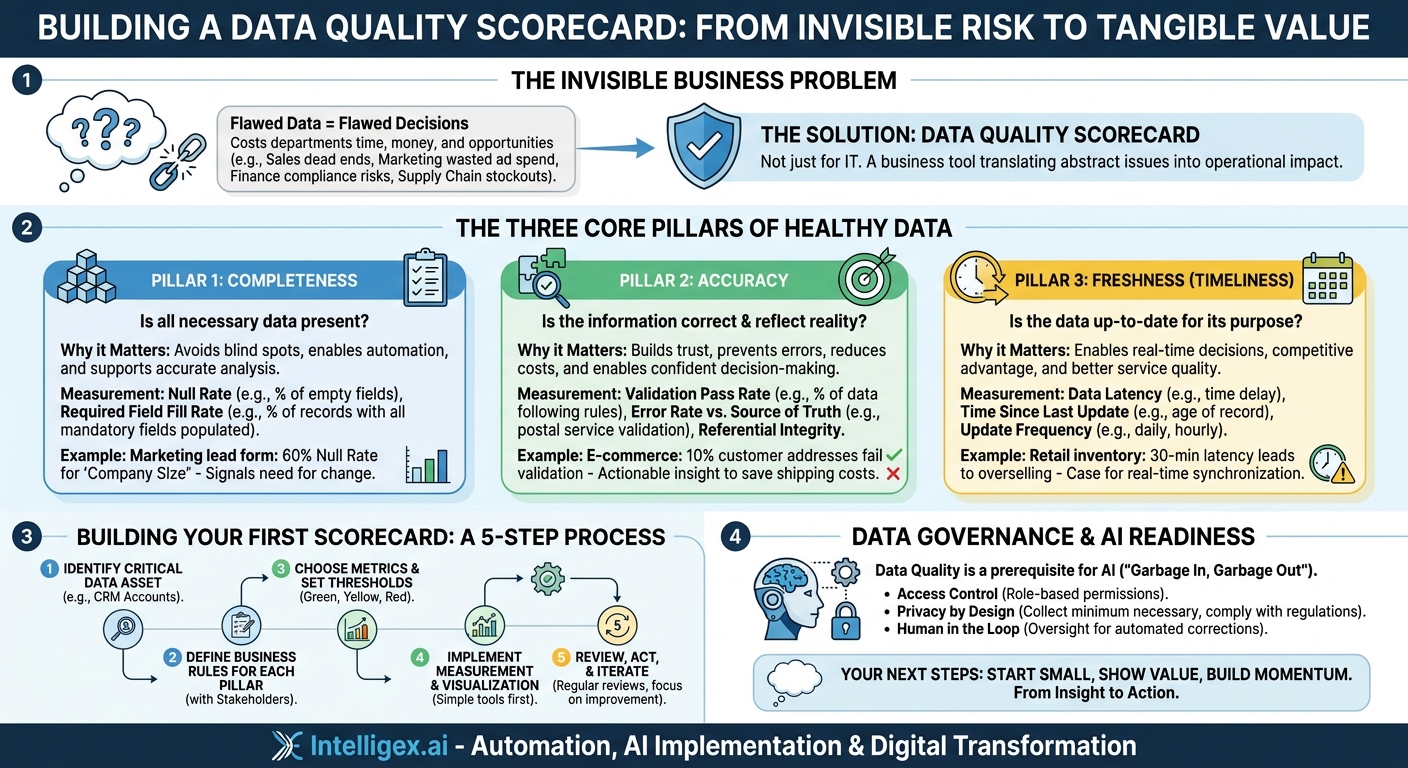
The solution isn’t another complex tool or a massive, multi-year data overhaul. It’s a simple, powerful concept: the Data Quality Scorecard. This isn’t a technical report meant only for IT. It’s a business tool that translates abstract data issues into tangible operational impact. By focusing on three core pillars, Completeness, Accuracy, and Freshness, you can create a shared understanding of your data’s health and build a practical roadmap for improvement that drives real business value.
Why a Data Quality Scorecard Isn’t Just for IT
Poor data quality is not a technology problem; it’s a business problem with business consequences. When data is unreliable, every department feels the pain, leading to friction, wasted resources, and missed opportunities. The scorecard acts as a bridge, making the impact of data issues visible to everyone.
Consider these common scenarios:
- Sales Teams struggle with incomplete or inaccurate contact information in their CRM. A high bounce rate on emails or disconnected phone numbers means reps waste valuable time on dead ends instead of building relationships and closing deals. The business cost is lost productivity and a slower sales cycle.
- Marketing Departments rely on customer data to segment audiences and personalize campaigns. If records are missing demographic information or purchase history is inaccurate, they can’t create relevant messaging. The result is wasted ad spend and low campaign ROI.
- Finance and Compliance Teams depend on precise transaction data for reporting and forecasting. Inaccurate figures can lead to serious compliance risks, flawed financial models, and poor strategic decisions. The cost is regulatory penalties and eroded investor confidence.
- Supply Chain and Operations need timely, accurate inventory data to manage stock levels. Stale data can lead to ordering too much of a slow-moving product (overstock) or running out of a bestseller (stockouts), directly impacting revenue and customer satisfaction.
A Data Quality Scorecard takes these departmental pains and quantifies them. It provides a common language that both business leaders and technical teams can use. Instead of IT reporting that “the null count in the customer address field is 15%,” the scorecard helps a business leader understand that “15% of our orders are at risk of shipping delays due to bad address data.” This shift in perspective turns data quality from a background IT task into a strategic business priority.
Pillar 1: Measuring Data Completeness
Completeness answers a simple question: Is all the necessary data present? It’s the most fundamental aspect of data quality. If the data isn’t there, you can’t use it for analysis, automation, or decision-making. It creates blind spots that hide both risks and opportunities.
Why Completeness Matters for Business Value
Incomplete data directly impacts visibility and scalability. Without a complete picture, your customer journey maps have gaps, your operational workflows have holes, and your growth plans are built on assumptions. Furthermore, automated systems and AI models are brittle. They often fail when they encounter missing values where they expect data, preventing you from scaling processes efficiently.
Think of an HR department trying to analyze workforce diversity. If a significant percentage of employee records are missing demographic data, the analysis is useless, and any resulting initiatives will be misguided. A complete dataset is the foundation for meaningful insight.
How to Measure Completeness
You don’t need to measure every single field. Start by identifying the data that is most critical for a specific business process. A good starting point is to ask stakeholders: “What information is absolutely essential for you to do your job?”
Key metrics for your scorecard include:
- Null Rate: The percentage of records where a specific field is empty or null. For example, the percentage of customer accounts in your Salesforce instance that are missing a phone number.
- Required Field Fill Rate: The percentage of records where a predefined set of mandatory fields are all populated. For example, for an e-commerce order to be “complete,” it must have a customer ID, product SKU, order date, and shipping address. The fill rate measures what percentage of your orders meet this minimum standard.
By tracking these metrics, a marketing team can see that their lead capture form has a 60% null rate for the “Company Size” field, immediately signaling that they need to make the field required or find another way to enrich that data.
Pillar 2: Validating Data Accuracy
Accuracy asks: Is the information correct and does it reflect reality? Data can be 100% complete but still be 100% wrong. An address field that is filled in for every customer is useless if a quarter of those addresses don’t actually exist.
Why Accuracy Matters for Business Value
Inaccurate data erodes trust and creates direct costs. When your team can’t trust the numbers in their reports, they stop using them. They revert to manual checks and gut feelings, slowing down the entire organization. The direct costs are even more obvious. Shipping a product to the wrong address incurs costs for returns, support calls, and redelivery. Basing a financial forecast on incorrect sales data can lead to poor capital allocation and missed targets.
Quality and trust are intertwined. An operations team that receives accurate, real-time production data can proactively address maintenance issues. A leadership team that trusts the financial reports can make bold, confident decisions. Accuracy is the bedrock of that trust.
How to Measure Accuracy
Measuring accuracy often involves validating data against a known set of rules or an external “source of truth.”
Key metrics for your scorecard include:
- Validation Pass Rate: The percentage of data values that conform to a predefined format or set of rules. For example, what percentage of email addresses in your database follow the `[email protected]` format? What percentage of US customer records have a valid 5-digit ZIP code?
- Error Rate vs. Source of Truth: The percentage of records that are found to be incorrect when compared against a reliable, external dataset. This could involve using a third-party service to validate mailing addresses against postal service records or cross-referencing company names against a business registry.
- Referential Integrity: In relational databases, this ensures that a record in one table has a valid corresponding record in another. For example, every `order` record should link to a valid `customer` record. A failure here indicates orphaned or inconsistent data.
An e-commerce company might find through its scorecard that 10% of its customer addresses fail validation. This is a clear, actionable insight that can be handed to a data stewardship team to begin a cleanup project, potentially saving thousands in shipping errors.
Pillar 3: Tracking Data Freshness (Timeliness)
Freshness, also known as timeliness or currency, asks: Is the data up-to-date enough for its intended purpose? The value of data often decays over time. A customer’s shipping address from five years ago is likely inaccurate. Real-time inventory data is critical; inventory data from last week is merely historical.
Why Freshness Matters for Business Value
The need for fresh data is driven by the demand for speed. In today’s market, the ability to make fast, informed decisions is a competitive advantage. A logistics manager needs real-time GPS data to reroute a delivery truck around a traffic jam, not a report on yesterday’s traffic patterns. A customer service agent needs a customer’s most recent interaction history to provide relevant support, not a record that is 24 hours out of date.
Stale data leads to poor service quality and operational inefficiency. It creates a lag between reality and what your systems are telling you, forcing your teams to work with an outdated picture of the world.
How to Measure Freshness
The definition of “fresh” is highly dependent on the business context. For financial reporting, data might need to be updated daily. For fraud detection, it might need to be updated in milliseconds.
Key metrics for your scorecard include:
- Data Latency: The time delay between an event occurring in the real world and that event being recorded and available for use in your system. For example, the latency for point-of-sale transaction data should be very low.
- Time Since Last Update: A measure of how recently a particular record or dataset was refreshed. For instance, you could track the average age of the “Last Contacted Date” for high-value leads in your CRM to ensure sales reps are engaging with them regularly.
- Update Frequency: How often a dataset is expected to be updated (e.g., hourly, daily, weekly). The metric here would be the percentage of times the update occurred on schedule.
A retail company’s scorecard might show that its website’s product inventory data has a latency of 30 minutes. If a popular item sells out quickly, this delay could result in overselling, leading to canceled orders and unhappy customers. This metric makes the case for investing in a more real-time inventory synchronization process.
Building Your First Data Quality Scorecard: A 5-Step Process
Creating a scorecard doesn’t require a massive software investment. You can start small, prove the value, and build momentum. The key is to focus on business impact, not technical perfection.
- Identify a Critical Data Asset. Don’t try to measure everything at once. Start with a single, high-value business process that is clearly suffering from data problems. This could be the lead-to-cash process, customer onboarding, or monthly financial closing. Identify the primary data asset that powers it, such as “Customer Accounts” in your CRM or “Product Records” in your ERP.
- Define Business Rules for Each Pillar. Sit down with the business stakeholders who use this data every day. Ask them simple questions to define your rules. For completeness: “What fields must be filled out for a new customer record to be useful?” For accuracy: “How do we know if a shipping address is valid?” For freshness: “How quickly do we need to know that a customer’s contact information has changed?”
- Choose Metrics and Set Thresholds. For each rule you defined, select a simple metric to track it (e.g., Null Rate, Validation Pass Rate, Latency). Then, work with the business to set acceptable thresholds. These should be color-coded: Green (Healthy), Yellow (At Risk), and Red (Critical). For example, a Null Rate for a customer email address below 2% might be Green, 2-5% Yellow, and above 5% Red. This makes the scorecard instantly skimmable.
- Implement Measurement and Visualization. The initial implementation can be surprisingly simple. You can often calculate these metrics with basic SQL queries or reports from your business applications. The first version of your scorecard could even be a shared spreadsheet that you update weekly. The goal is to automate the data collection as much as possible so you can focus on the insights, not the manual effort.
- Review, Act, and Iterate. A scorecard is useless if no one looks at it. Schedule a regular, brief review meeting with the key stakeholders. When a metric turns Red, the goal isn’t to assign blame but to ask “Why?” and create a small, focused plan to fix it. Use the scorecard to track the improvement over time. This demonstrates the value of your data quality initiatives and builds the case for further investment.
Data Governance and AI Readiness
A strong data quality program is no longer just good practice; it is a prerequisite for leveraging advanced technologies like AI and machine learning. AI models are powerful but incredibly sensitive to the quality of the data they are trained on. The old adage “garbage in, garbage out” is magnified tenfold with AI. A model trained on incomplete customer data will produce flawed predictions, and one trained on inaccurate sales data will generate useless forecasts.
Your Data Quality Scorecard is a direct measure of your AI readiness. However, as you work to improve data quality, it’s crucial to implement it safely and ethically.
Keep these governance principles in mind:
- Access Control: Use your scorecard to identify sensitive data assets, such as personally identifiable information (PII). Ensure that access to this data is strictly controlled on a role-based, need-to-know basis. Not everyone who can view a customer’s name needs to see their contact details.
- Privacy by Design: When defining completeness and accuracy rules, always consider privacy. Do you truly need to collect every piece of data? Is it being stored and handled in compliance with regulations like GDPR? The goal is to have the *minimum necessary* data to run the business effectively.
- Human in the Loop: Automation is key to scaling data quality efforts, but it requires oversight. If you build an automated process to “correct” addresses based on scorecard metrics, ensure there is a human review step for exceptions or low-confidence changes. A flawed automation can cause more damage than the original problem.
Your Next Steps: From Insight to Action
A Data Quality Scorecard is a journey, not a one-time project. The goal is to create a sustainable rhythm of measurement, insight, and improvement. Don’t wait for the perfect tool or the perfect plan. Start now with what you have.
Here is a simple action plan to get started:
- This Week: Schedule a 30-minute meeting with one or two people from a business team (like Sales or Operations) and a counterpart from IT or data analytics. Your only goal is to identify one business process and the one key data asset that supports it (e.g., “Lead follow-up” and “Contact records”).
- This Month: Using a simple spreadsheet, build a pilot scorecard for that single data asset. Define one rule and one metric for each pillar: Completeness, Accuracy, and Freshness. Manually calculate the scores for the first time to establish a baseline.
- This Quarter: Review your pilot scorecard weekly. Use the first red or yellow metric you find to launch a small, targeted data cleanup effort. Track the score before and after. Share this small win with leadership to demonstrate the tangible value of focusing on data quality. This success will be the foundation for expanding your efforts.
By taking these small, practical steps, you can move data quality from an abstract technical concern to a core driver of business performance, building a more resilient, efficient, and intelligent organization.
Your Next Read:
Category:
Get a FREE
Proof of Concept
& Consultation
No Cost, No Commitment!
