

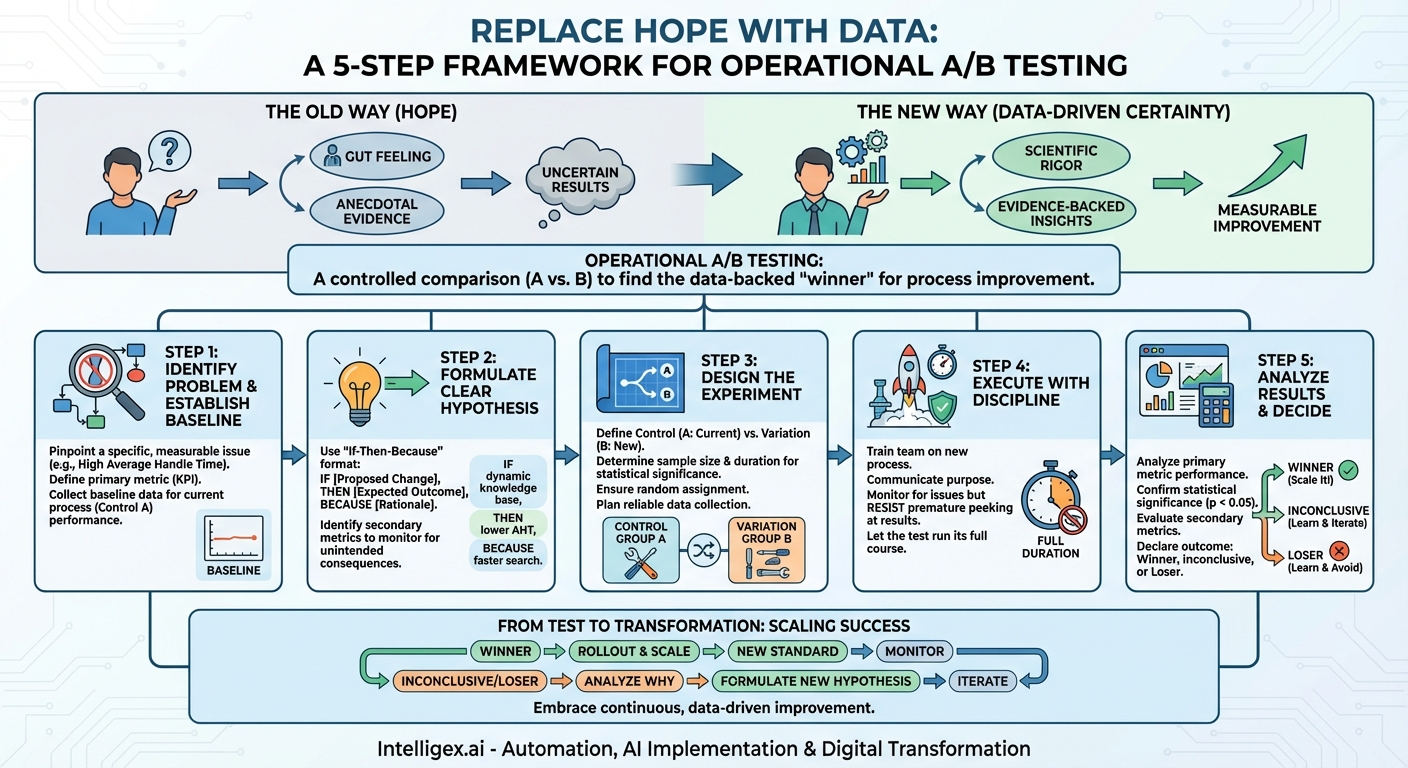
In the world of business operations, the drive for efficiency is relentless. We constantly seek ways to make our processes faster, cheaper, and more reliable. Too often, however, these “improvements” are based on gut feelings, anecdotal evidence, or the loudest voice in the room. We implement a new workflow, a new piece of software, or a new script, hoping it will work. Hope, however, is not a strategy. What if there was a way to replace that hope with data-driven certainty? What if you could apply the same scientific rigor that digital marketers use to optimize landing pages to streamline your warehouse, supercharge your call center, or perfect your back-office tasks?
This is where A/B testing, a concept traditionally confined to the marketing department, becomes a revolutionary tool for operational excellence. By adopting a structured A/B testing framework, you can move beyond guesswork and start making informed, evidence-backed decisions that create measurable and sustainable improvements. This approach allows you to test changes in a controlled environment, mitigate the risk of large-scale failures, and build a culture of continuous, data-driven improvement from the ground up.
Beyond Button Colors: What is Operational A/B Testing?
At its core, A/B testing (or split testing) is a simple method of comparison. You take a variable you want to improve, create two versions—a control (A) and a variation (B)—and then measure which version performs better against a specific goal. In marketing, this might be comparing two different headlines to see which one gets more clicks. In operations, the principle is identical, but the applications are far broader and can have a profound impact on your bottom line.
Think of it as a head-to-head competition between your current way of doing things and a proposed new way. The “winner” is decided not by opinion, but by cold, hard data. Here are a few examples of what this looks like in practice:
- Logistics: Does a new, algorithm-generated picking route (Variation B) in a warehouse result in a faster average order fulfillment time than the standard, zone-based route (Control A)?
- Customer Support: Does a revised email template (Variation B) for handling common support queries lead to a higher first-contact resolution rate and better customer satisfaction scores than the old template (Control A)?
- Data Entry: Does using a new AI-powered document scanner (Variation B) reduce the time and error rate for processing invoices compared to the manual data entry process (Control A)?
- Sales Operations: Does a simplified, 5-field lead qualification form (Variation B) result in a higher volume of quality leads being passed to the sales team than the complex, 12-field form (Control A)?
In each case, you are isolating a single change and measuring its direct impact on a critical operational Key Performance Indicator (KPI). This methodical approach removes ambiguity and provides clear, actionable insights.
Why a Framework is Non-Negotiable
Jumping into testing without a plan is a recipe for disaster. Ad-hoc testing often leads to inconclusive results, wasted resources, and flawed conclusions. Confirmation bias can easily creep in, causing you to interpret ambiguous data in a way that supports your preconceived notions. Without a structured framework, you risk:
- Contaminated Data: Failing to properly randomize your test groups or changing multiple variables at once makes it impossible to know what truly caused the outcome.
- Statistical Insignificance: Running a test for too short a time or with too small a sample size can lead to fluke results that aren’t repeatable.
- Unforeseen Consequences: Focusing only on one metric might cause you to miss a negative impact elsewhere. For example, a new process might be faster but also produce a much higher error rate.
- Lack of Scalability: A successful but poorly documented test is a one-time win. A framework ensures that learnings are captured, shared, and used to inform future improvements across the organization.
A framework provides the necessary discipline to turn your operational improvement efforts from a chaotic art into a repeatable science.
A Step-by-Step Framework for Operational A/B Testing
To bring structure and rigor to your efforts, follow this five-step framework. It will guide you from identifying a problem to implementing a proven solution.
Step 1: Identify the Problem and Establish a Baseline
You can’t improve what you don’t measure. The first step is to pinpoint a specific, measurable problem.
- Get Specific: Don’t start with a vague goal like “improve call center efficiency.” Instead, drill down to a precise issue, such as, “Our average handle time (AHT) for billing inquiries is 450 seconds, which is 20% above our target.”
- Define Your Primary Metric: This is the single Key Performance Indicator (KPI) that will determine if your test is a success. It must be quantifiable. Examples include Cycle Time, Error Rate, Cost Per Unit, Customer Satisfaction (CSAT), or First Contact Resolution (FCR). In our example, the primary metric is Average Handle Time.
- Establish a Baseline: Before you can test an improvement, you need to know your starting point. Collect data on your primary metric for the current process over a significant period (e.g., several weeks or months) to understand the existing performance and its natural variation. This baseline is your Control (A).
Step 2: Formulate a Clear Hypothesis
A hypothesis is an educated, testable prediction about the outcome of your proposed change. It’s the core of your experiment. A strong hypothesis provides clarity and focus, preventing you from getting lost in the data later on.
The best way to structure your hypothesis is using the “If-Then-Because” format:
If we implement [THE PROPOSED CHANGE], then we will see [THE EXPECTED OUTCOME IN THE PRIMARY METRIC], because [THE RATIONALE].
Let’s continue with our call center example:
Hypothesis: “If we provide agents with a dynamic knowledge base article that automatically populates based on the customer’s stated issue, then we will reduce Average Handle Time by at least 30 seconds, because agents will spend less time searching for information and more time resolving the issue.”
It’s also crucial to identify secondary metrics. These are other KPIs that might be affected by your change. For the call center, secondary metrics could include First Contact Resolution and Customer Satisfaction. You want to ensure that in your quest to reduce call time, you aren’t accidentally making customers less happy or failing to solve their problems on the first try.
Step 3: Design the Experiment
This is where you lay out the technical details of your test to ensure the results are valid and trustworthy.
- Define Control vs. Variation: Your Control (A) is the existing process (agents using the old, static knowledge base). Your Variation (B) is the new process (agents using the new, dynamic knowledge base). It is critical that the *only* difference between the two groups is the tool they are using.
- Determine Sample Size and Duration: You need enough data to achieve statistical significance—a high degree of confidence that your results aren’t just random chance. Use an online sample size calculator to determine how many interactions (calls, orders, etc.) you need in each group. This will also help you estimate the required duration of the test. Don’t cut it short just because you see an early trend.
- Ensure Randomization: To eliminate bias, you must assign work randomly. For our call center, you could use an ACD system to randomly route billing-related calls to a pool of agents, half of whom are designated as the control group and half as the variation group for the duration of the test. You can’t let agents choose which system to use or assign all the “easy” agents to the new system.
- Plan Data Collection: How, exactly, will you gather the data for your primary and secondary metrics for both groups? Ensure the tracking is consistent, automated where possible, and accurate.
Step 4: Execute the Test with Discipline
With a solid plan in place, it’s time to run the experiment. Execution requires communication and discipline.
- Train and Communicate: Ensure the team testing the new process (Group B) is properly trained. Communicate the purpose and duration of the test to all involved parties, including managers. Transparency is key to getting buy-in and cooperation.
- Monitor Closely: As the test runs, keep an eye on the process. Are there any unexpected technical issues? Are the participants following the correct procedures? Early monitoring can help you catch problems that could invalidate your test results.
- Resist the Urge to Peek: It’s tempting to check the results every hour. Avoid this. Making premature decisions based on incomplete data is one of the biggest pitfalls of A/B testing. Let the experiment run its full, predetermined course to collect a clean and complete data set.
Step 5: Analyze Results and Make a Decision
Once the test is complete, it’s time to become a data scientist. Your opinion no longer matters; the numbers will tell the story.
- Analyze the Primary Metric: Compare the performance of the control and the variation. Did the new knowledge base reduce the Average Handle Time? By how much?
- Confirm Statistical Significance: This is the most important part of the analysis. Use a statistical significance calculator or a t-test to determine the p-value. A common threshold for significance is a p-value of less than 0.05, which means there is less than a 5% probability that the observed difference between the groups was due to random chance. If your result is statistically significant, you can be confident that your change caused the effect.
- Evaluate Secondary Metrics: Did the change have any unintended consequences? In our example, did the faster calls also lead to lower First Contact Resolution or a drop in CSAT scores? If so, the “win” on your primary metric may not be worth the cost.
- Declare an Outcome:
- Clear Winner: The variation showed a statistically significant improvement in the primary KPI without negatively impacting secondary metrics.
- Inconclusive: There was no significant difference between the two versions.
- Clear Loser: The variation performed significantly worse than the control.
From Test to Transformation: Scaling Your Success
The value of an A/B test is only realized when you act on the results. If your test produced a clear winner, the next step is implementation. Develop a plan to roll out the winning variation to the entire team or department. This plan should include training, updating Standard Operating Procedures (SOPs), and communicating the “why” behind the change, backed by the data from your successful test.
But what if the test was inconclusive or the variation lost? This is not a failure—it’s a valuable learning. You just saved your organization time, money, and resources by preventing the rollout of an ineffective change. An inconclusive result is data. It tells you that your hypothesis was incorrect. The next step is to analyze *why* it might have been wrong and formulate a new, more informed hypothesis to test next. This iterative loop of hypothesizing, testing, and learning is the engine of true continuous improvement.
By embracing a rigorous A/B testing framework, you transform your operations from a series of static procedures into a dynamic laboratory for innovation. You empower your teams to challenge the status quo, test new ideas in a risk-free way, and build a culture where decisions are made not on seniority or opinion, but on verifiable proof. Start small, pick a measurable problem, and launch your first test. The journey to operational excellence begins with a single, well-structured experiment.
Your Next Read:
Category:
Get a FREE
Proof of Concept
& Consultation
No Cost, No Commitment!
