Imagine driving a car across the country using only your rearview mirror. You’d know exactly where you’ve been, the miles you’ve covered, and the landmarks you’ve passed. You’d have a perfect, unchangeable record of the journey so far. But you’d have absolutely no idea what’s coming next—a sharp curve, a traffic jam, or a dead end. You’d be reacting to the road only after you’ve already run off it. This is precisely what happens when businesses manage their process improvement initiatives by focusing solely on lagging indicators.
In the quest for continuous improvement, data is king. But not all data is created equal. The metrics we choose to track and act upon can mean the difference between proactive, strategic growth and reactive, frantic problem-solving. The distinction lies in understanding the powerful relationship between two types of metrics: lagging and leading indicators. While most organizations are masters at tracking the former, true process excellence is unlocked by embracing the latter.
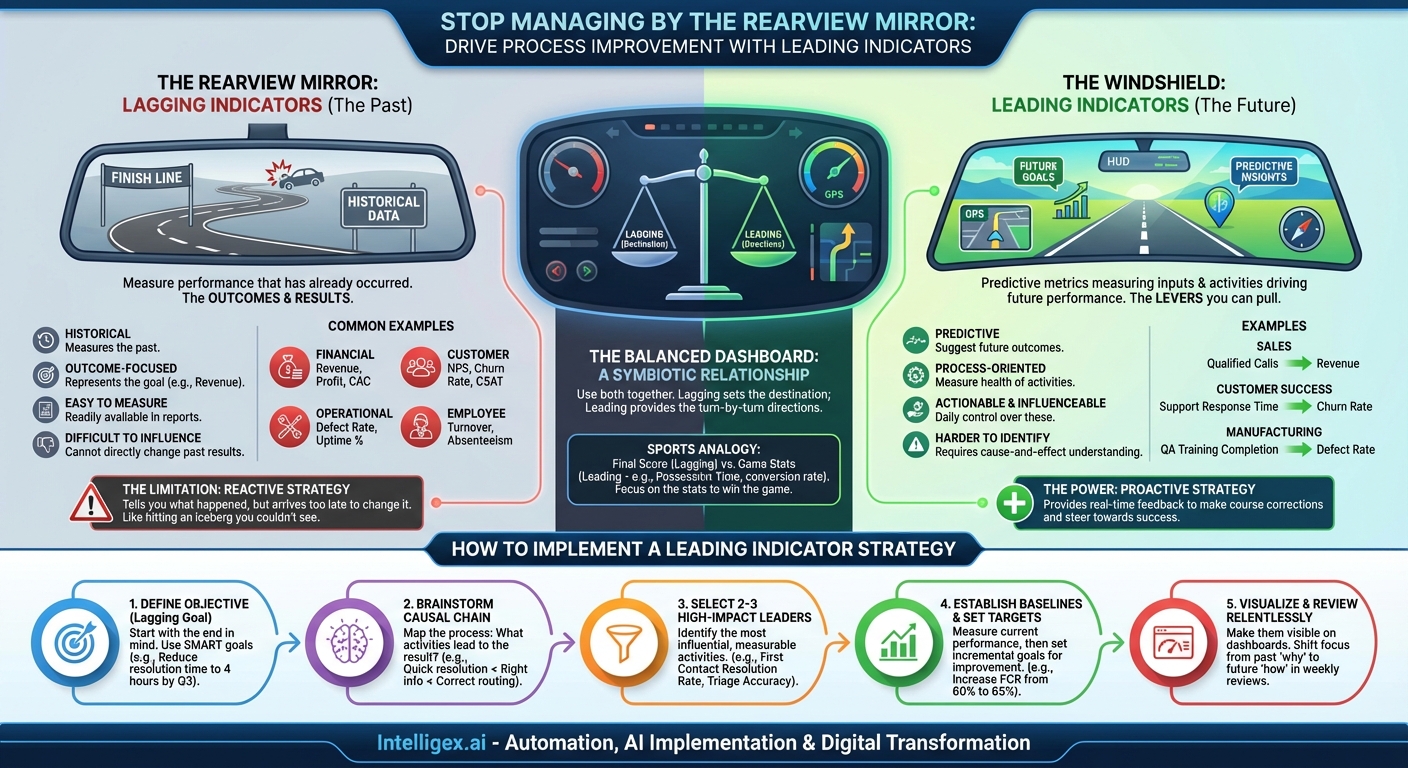
The Rearview Mirror: A Deep Dive into Lagging Indicators
Lagging indicators are the most common type of metric found in business reports and executive dashboards. As their name suggests, they measure performance that has already occurred. They are the outcomes, the results, and the historical evidence of success or failure.
Characteristics of Lagging Indicators
- Historical: They measure the past. By the time you see the number, the events that created it are over.
- Outcome-Focused: They represent the ultimate goal or a major milestone, such as revenue, profit, or customer satisfaction.
- Easy to Measure: Lagging indicators are often straightforward to collect and quantify. Financial statements and system reports are full of them.
- Difficult to Influence Directly: You cannot directly change last quarter’s revenue. You can only influence the activities that will generate next quarter’s revenue.
Common Examples of Lagging Indicators
Lagging indicators are prevalent across all business functions:
- Financial: Quarterly Revenue, Net Profit Margin, Customer Acquisition Cost (CAC), Earnings Per Share (EPS).
- Customer: Net Promoter Score (NPS), Customer Satisfaction (CSAT) Score, Customer Churn Rate, Customer Lifetime Value (CLV).
- Operational: On-Time Delivery Percentage, Defect Rate, Average Resolution Time, Uptime Percentage.
- Employee: Employee Turnover Rate, Employee Satisfaction Score, Absenteeism Rate.
The Inherent Limitation
While essential, relying exclusively on lagging indicators is a fundamentally reactive strategy. They tell you that you’ve hit the iceberg, but they don’t help you steer around it. For example, a high customer churn rate (a lagging indicator) is a critical piece of information. It tells you that you have a problem. However, it gives you zero insight into why customers are leaving or what specific actions you need to take today to prevent more from leaving tomorrow. It’s the final grade on a report card; it tells you how you performed, but it arrives too late to change the outcome.
By managing with lagging indicators, you are essentially trying to drive a company forward by looking in the rearview mirror. It tells you a lot about where you’ve been, but nothing about where you’re going.
The Windshield: Predicting the Future with Leading Indicators
If lagging indicators are the rearview mirror, leading indicators are the windshield, the GPS, and the dashboard gauges combined. They are the predictive, forward-looking metrics that measure the inputs, activities, and conditions that will likely drive future performance. They are the levers you can pull to change the future outcome.
Characteristics of Leading Indicators
- Predictive: A positive change in a leading indicator suggests a future positive change in a corresponding lagging indicator.
- Actionable and Influenceable: Your team has direct control over these metrics on a daily or weekly basis. They can actively work to improve them.
- Harder to Identify and Measure: Finding the right leading indicators requires a deep understanding of cause-and-effect relationships within your processes. They are often less obvious than their lagging counterparts.
*Process-Oriented: They measure the health and performance of the processes and activities that produce the final results.
Uncovering Powerful Leading Indicators
The magic of leading indicators is that they are directly tied to the lagging indicators you care about. To find them, you must work backward from your desired outcome.
Let’s pair some of our earlier lagging indicators with potential leading indicators:
- Goal (Lagging): Increase Quarterly Sales Revenue.
- Leading Indicators: Number of qualified sales calls made per week, value of new opportunities added to the pipeline, demo-to-trial conversion rate. A team can’t directly control revenue, but they can control how many calls they make.
- Goal (Lagging): Decrease Customer Churn Rate.
- Leading Indicators: Average support ticket response time, customer onboarding completion rate, percentage of customers using a key feature, number of proactive wellness checks conducted by account managers. Improving these makes customers more likely to stay.
- Goal (Lagging): Reduce Manufacturing Defect Rate.
- Leading Indicators: Percentage of employees who have completed quality assurance training, frequency of preventative machine maintenance, adherence rate to process checklists. These activities prevent defects before they happen.
The power here is unmistakable. A sales manager can’t command her team to “increase revenue by 10%.” But she can coach them to “increase qualified calls by 15%,” a tangible, influenceable action that is highly likely to lead to the desired revenue increase.
Creating a Balanced Dashboard: The Symbiotic Relationship
The debate isn’t about choosing one type of indicator over the other. The goal is not to replace lagging indicators with leading ones. True process improvement mastery comes from using them together in a balanced system. You need both the rearview mirror and the windshield to navigate effectively.
- Lagging indicators set the destination and tell you if you’ve arrived. They confirm if your strategy is working over the long term.
- Leading indicators are the turn-by-turn directions. They give you real-time feedback and allow you to make course corrections along the way.
Think of a professional sports team. The final score of the game is the ultimate lagging indicator. It’s what matters in the standings. But the coach and players don’t focus on the final score during the game. They focus on the leading indicators: time of possession, turnover margin, third-down conversion rate, and free throw percentage. They know that by winning on these process-driven metrics, the final score will take care of itself. Your business is no different.
How to Implement a Leading Indicator Strategy for Process Improvement
Transitioning to a more forward-looking approach requires a structured methodology. Here’s a practical framework to get you started.
Step 1: Clearly Define Your Objective (The Lagging Indicator)
Start with the end in mind. What is the big, outcome-based result you are trying to achieve? Use the SMART (Specific, Measurable, Achievable, Relevant, Time-bound) framework to define this goal. For example, instead of “improve customer support,” a better goal is “Reduce our average ticket resolution time from 8 hours to 4 hours by the end of Q3.” This gives you a clear lagging indicator to anchor your efforts.
Step 2: Brainstorm the Causal Chain
Once you have your lagging goal, gather the team responsible for that outcome and ask the critical question: “What activities, if done consistently and with high quality, will lead to this result?”
Map out the process. For the ticket resolution goal, the chain might look like this:
- A ticket is resolved quickly (Lagging).
- This happens because the support agent has the right information and tools.
- This happens because tickets are routed to the correct specialist immediately.
- This happens because the initial ticket submission process gathers clear, categorized information.
Step 3: Select 2-3 High-Impact Leading Indicators
From your brainstorm, identify the most influential and measurable activities. Avoid the temptation to track everything. A crowded dashboard is an ignored dashboard. For our ticket resolution example, you might select:
- First Contact Resolution (FCR) Rate: The percentage of tickets solved during the very first interaction. A high FCR rate dramatically lowers the average overall resolution time.
- Internal Knowledge Base Usage: The number of times support agents consult the internal documentation. This indicates they are actively seeking correct, standardized answers rather than guessing.
- Ticket Triage Accuracy: The percentage of tickets correctly categorized and routed upon submission. This prevents delays from tickets bouncing between departments.
These are all influenceable. The team can be trained to improve FCR, incentivized to contribute to the knowledge base, and provided better tools for triage.
Step 4: Establish Baselines and Set Targets
You can’t manage what you don’t measure. For each of your chosen leading indicators, track them for a few weeks to establish a baseline. Where are you starting from? Once you have a baseline, set incremental improvement targets for them. For instance, “Increase FCR from 60% to 65% this month.”
Step 5: Visualize and Review Relentlessly
Make these leading indicators visible. Put them on a team dashboard that is reviewed in weekly meetings. The conversation should shift from “Why was our resolution time so high last month?” (a lagging, historical review) to “Our FCR rate is down 3% this week. What challenges are we facing, and how can we support the team to get it back on track by Friday?” (a proactive, leading discussion).
This regular cadence of review and action is where the magic happens. It transforms your team from passive observers of results to active drivers of performance.
By shifting your focus from the past to the future, from outcomes to processes, you empower your teams to take ownership. Lagging indicators tell you the score at the end of the game. Leading indicators show you how to run the plays that win it. Stop driving by looking in the rearview mirror. Grab the steering wheel, focus on the road ahead, and use leading indicators to navigate your way to predictable and sustainable success.
Related Posts
Category:
Get a FREE
Proof of Concept
& Consultation
No Cost, No Commitment!