

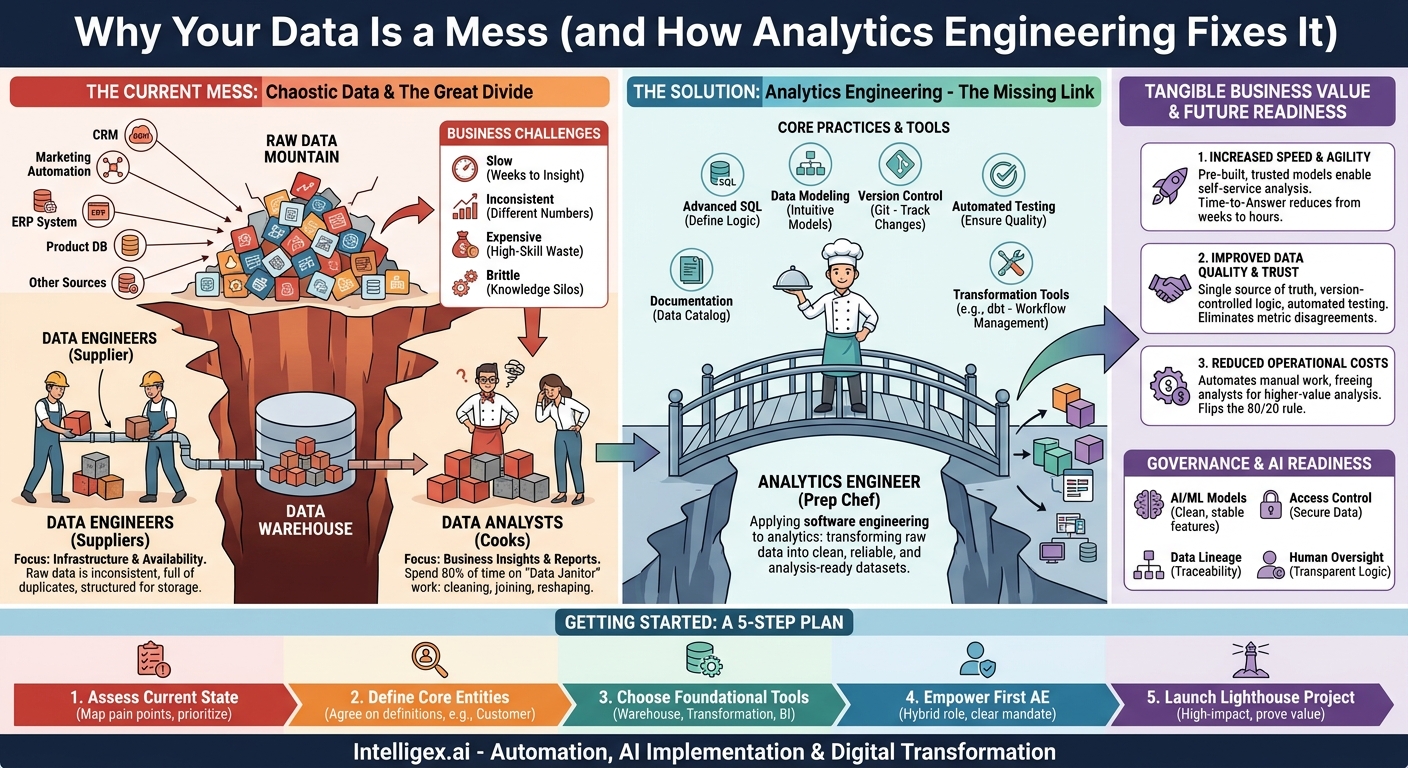
Your organization is sitting on a mountain of data. It comes from your CRM, your marketing automation platform, your ERP system, and a dozen other sources. You know there are valuable insights hidden inside, yet getting clear, trustworthy answers to simple business questions feels impossibly slow and complicated. When your sales and finance teams present different revenue numbers for the same quarter, who do you trust? Why does it take three weeks for marketing to get a basic campaign performance report?
This is not a people problem. It’s a process problem. A gap exists between the teams that collect data and the teams that need to use it for decision-making. Filling this gap is the job of a relatively new but critical function: analytics engineering. In short, analytics engineering applies the discipline of software engineering to the world of analytics, transforming raw, messy data into clean, reliable, and analysis-ready datasets.
The Great Divide: Why Traditional Data Teams Struggle
For years, data teams operated in a two-part model. On one side, you have Data Engineers. They are infrastructure experts who build robust pipelines to extract data from sources like Salesforce or your product database and load it into a central data warehouse. Their primary job is to make the data available.
On the other side, you have Data Analysts. They are business experts who understand what the company needs to measure. They query the data warehouse to build dashboards and reports that answer questions for leadership, marketing, operations, and other departments.
The problem lies in the enormous chasm between these two roles. The raw data that engineers provide is rarely in a format that analysts can immediately use. It’s often inconsistent, full of duplicates, and structured for storage, not for questioning. This leaves analysts spending up to 80% of their time on “data janitor” work: cleaning, joining, and reshaping data just to get to a starting point. This manual, repetitive work creates several critical business challenges:
- It’s slow. When every new question requires a custom data cleaning script, the time-to-insight is measured in weeks, not hours. Business opportunities are missed while waiting for answers.
- It’s inconsistent. Two different analysts, asked to calculate “customer lifetime value,” might write their own logic. They could filter customer lists differently or define “active customer” in slightly different ways, leading to two different numbers. This erodes trust in all data.
- It’s expensive. You are paying highly skilled analysts to perform low-value, repetitive tasks. Meanwhile, your expensive data engineers are pulled away from critical infrastructure work to build one-off data transformations for the analytics team, creating a bottleneck for everyone.
- It’s brittle. The logic used to create a critical report often lives on an analyst’s local machine in a massive SQL file. If that analyst leaves, their knowledge walks out the door with them, and no one else can decipher or maintain their work.
Enter the Analytics Engineer: More Than Just SQL
An analytics engineer lives in the space between data engineering and data analysis. Their mission is to build a solid, reusable foundation for all analytics work. They take the raw data provided by data engineers and apply software engineering best practices to transform it into a set of clean, well-documented, and trusted data models that the entire organization can use.
Think of it like a professional kitchen. The data engineers are the suppliers who deliver raw ingredients (vegetables, meat, spices). The analytics engineer is the prep chef who washes, chops, and prepares all those ingredients into organized, ready-to-use “mise en place” stations. The data analysts are the line cooks who can now quickly grab those prepared ingredients to assemble and cook complex dishes (reports, dashboards, insights) on demand.
What do they actually do? Analytics engineers focus on the “T” in ELT (Extract, Load, Transform). They work inside the data warehouse and use specific tools and practices to build this transformation layer.
Core Practices and Tools
- Advanced SQL: They are masters of SQL, using it to define business logic and structure data.
- Data Modeling: They design and build logical data models, such as `dim_customers` or `fct_orders`, that are intuitive for business users and performant to query.
- Version Control (Git): All transformation code is stored in a shared repository like Git. This means every change is reviewed, tracked, and can be rolled back if something breaks. It answers the question, “Who changed this metric definition, and why?”
- Automated Testing: They write tests to ensure data quality. For example, a test can automatically check that the primary key in a `users` table is always unique or that a `revenue` column never contains a negative value.
- Documentation: They document data models, column definitions, and business logic directly in their code. This documentation can then be automatically published into a company-wide data catalog.
- Transformation Tools: They use modern tools to manage this entire workflow. The industry standard is dbt (Data Build Tool), an open-source framework that brings all these software engineering principles to analytics code. You can learn more at their official site: https://www.getdbt.com/.
The Tangible Business Value of Analytics Engineering
Implementing an analytics engineering function is not just about organizing data better. It’s about driving real, measurable business outcomes by improving the speed, quality, and efficiency of your entire data operation.
1. Increased Speed and Agility
By creating a library of pre-built, trusted data models, analytics engineers empower analysts to self-serve. Instead of starting from scratch with raw data for every request, analysts can query clean tables where business logic is already applied.
- Scenario: The Head of Sales asks, “What’s the average sales cycle length for enterprise deals closed last quarter, broken down by region?” Before, an analyst would spend days joining raw opportunity, account, and user data. With analytics engineering, they can query a pre-built `fct_sales_deals` table and get an answer in minutes.
- What to Measure: Track the “Time-to-Answer” for common business questions. Aim to reduce it from weeks to days, and eventually from days to hours.
2. Improved Data Quality and Trust
When business logic is defined once, in version-controlled code, and automatically tested, you create a single source of truth. Disagreements over numbers become a thing of the past because everyone is building from the same foundational data models.
- Scenario: The finance team’s revenue report doesn’t match the marketing team’s report on revenue from paid campaigns. The analytics engineer can use data lineage tools to trace both reports back to their source. They discover marketing was excluding refunded orders. They update the central `fct_revenue` model to correctly handle refunds, and now all downstream reports are consistent.
- What to Measure: Monitor the number of data-related support tickets or bug reports. A successful implementation will see these decrease significantly over time.
3. Reduced Operational Costs
Analytics engineering automates the manual, repetitive work that consumes most of an analyst’s time. This frees them up to focus on higher-value activities like deep analysis, forecasting, and strategic recommendations.
- Scenario: Four different analysts were all writing their own, slightly different queries to define a “churned customer.” An analytics engineer centralizes this logic into a single, automated daily job. This not only ensures consistency but also saves dozens of analyst hours per month and reduces redundant compute costs in the data warehouse.
- What to Measure: Survey your data analysts to measure the percentage of their time spent on data preparation versus actual analysis. The goal is to flip the 80/20 rule, so they spend 80% of their time on analysis.
Getting Started: A 5-Step Plan for Implementation
Adopting analytics engineering is a journey, not an overnight switch. Here is a practical, step-by-step process to begin building this capability within your organization.
- Assess Your Current State. Before you build, you must understand the landscape. Sit down with your business intelligence team, data analysts, and key business stakeholders. Map out your current data flow and identify the biggest pain points. Ask questions like, “Which reports take the longest to build?” and “Which metrics do we argue about the most?” This discovery phase will help you prioritize where to focus first.
- Define Your Core Business Entities. Don’t try to boil the ocean. Start by identifying and agreeing on the definitions for a handful of your most critical business concepts. This could be your “customers,” “products,” “orders,” or “subscriptions.” Work with stakeholders from different departments to write down, in plain English, exactly what constitutes a single, unified definition for each. This is the foundation of your future data models.
- Choose Your Foundational Tools. A modern data stack is modular, so you can start small. The three essential components are a cloud data warehouse, a transformation tool, and a business intelligence (BI) platform.
- Warehouse: A central place to store your data, like Snowflake, Google BigQuery, or Amazon Redshift.
- Transformation: A tool to manage your data modeling code, with dbt being the clear leader.
- BI Tool: The platform your team uses to explore data and build dashboards, such as Tableau, Power BI, or Looker.
- Empower Your First Analytics Engineer. This role is a hybrid of skills. Your first analytics engineer could be a SQL-savvy data analyst who wants to learn software engineering practices, or a software engineer who is passionate about data and business logic. Give them a clear mandate, the right tools, and the space to focus on building foundational data models instead of ad-hoc reports.
- Launch a “Lighthouse” Project. Select one high-impact, high-visibility business area to prove the value of this new approach. A great first project is often creating a single source of truth for sales and marketing funnel data. Build clean, tested, and well-documented models for leads, opportunities, and customers. When stakeholders see how fast and reliable the new reporting is, you will build the momentum needed to scale the function across the organization.
Checklist: Is Your Organization Ready for Analytics Engineering?
Wondering if this is the right time to invest in an analytics engineering function? If you answer “yes” to several of the following questions, it’s a strong indicator that you’re feeling the pain that this role is designed to solve.
- Do you have a cloud data warehouse (like BigQuery, Redshift, or Snowflake) where most of your key data is already centralized?
- Do your data analysts frequently complain about poor data quality or spending too much time cleaning data?
- Do leaders from different departments often show up to meetings with different numbers for the same core business metric (e.g., monthly active users, customer count)?
- Are your data engineers acting as a bottleneck, overwhelmed with requests from the business for custom datasets and reports?
- Is there a strong desire to become a more data-driven company, but a fundamental lack of trust in the data prevents progress?
- Are you planning to scale your business and need a way to scale your data capabilities without linearly increasing the size of your data team?
If these challenges resonate, analytics engineering offers a structured path toward a more reliable and scalable data future.
A Note on Governance and AI Readiness
Strong analytics engineering practices do more than just improve dashboards. They build the trustworthy foundation required for more advanced applications like artificial intelligence and machine learning.
AI models are incredibly sensitive to the quality of the data they are trained on. The phrase “garbage in, garbage out” has never been more true. Analytics engineers are responsible for producing the clean, stable, and well-defined “features” (e.g., a customer’s lifetime value, their tenure, their last activity date) that data scientists use to build predictive models. Without this disciplined data preparation, AI initiatives are likely to fail or produce unreliable results.
Furthermore, this approach inherently improves data governance and security:
- Access Control: By separating raw data from clean, modeled data, you can set stricter permissions. For example, only a few people might have access to raw tables containing personally identifiable information (PII), while the entire company can access an aggregated, anonymized `daily_activity_summary` model.
- Data Lineage: Modern transformation tools automatically generate a map of data lineage. This allows you to see exactly where a metric came from, what transformations were applied, and which dashboards it impacts. This is essential for compliance audits (like GDPR) and for quickly debugging issues.
- Human Oversight: While the process is automated, the logic is not a black box. Every transformation is defined in human-readable code, reviewed by a peer, and version-controlled. This maintains clear accountability and transparency in how your data is processed. For examples of cloud data platform documentation, you can explore resources like those for Google Cloud’s BigQuery or offerings from vendors like Amazon Web Services.
Your Next Steps: From Insight to Action
Analytics engineering is about creating a “data factory” that systematically turns raw materials into valuable, finished products. It’s a strategic shift from a reactive, ad-hoc data culture to a proactive, scalable one. By investing in this function, you build a reliable data asset that will serve your company for years to come, enabling faster decisions, more trusted insights, and a solid foundation for future innovation.
Ready to move forward? Here are three simple actions you can take this week:
- Host a “Data Pain Point” Session. Get a small group of data analysts and business users together for 45 minutes. Ask them two questions: “What is the most valuable business question that is currently impossible for you to answer?” and “Which number or report do you trust the least, and why?” Their answers will be your roadmap.
- Audit One Critical Metric. Pick the most important KPI on your company’s main dashboard. Task one person with tracing its entire data lineage, from the source system to the dashboard. Document every single filter, join, and calculation. The complexity and inconsistencies you uncover will make the case for a more structured approach.
- Run a Small Proof of Concept. You don’t need a massive budget to start. Choose a single, messy-but-important data source. Challenge a technically-minded analyst to use a tool like dbt to clean, model, test, and document it. Measure the “before and after” in terms of analyst time saved and stakeholder confidence.
Your Next Read:
Category:
Get a FREE
Proof of Concept
& Consultation
No Cost, No Commitment!