

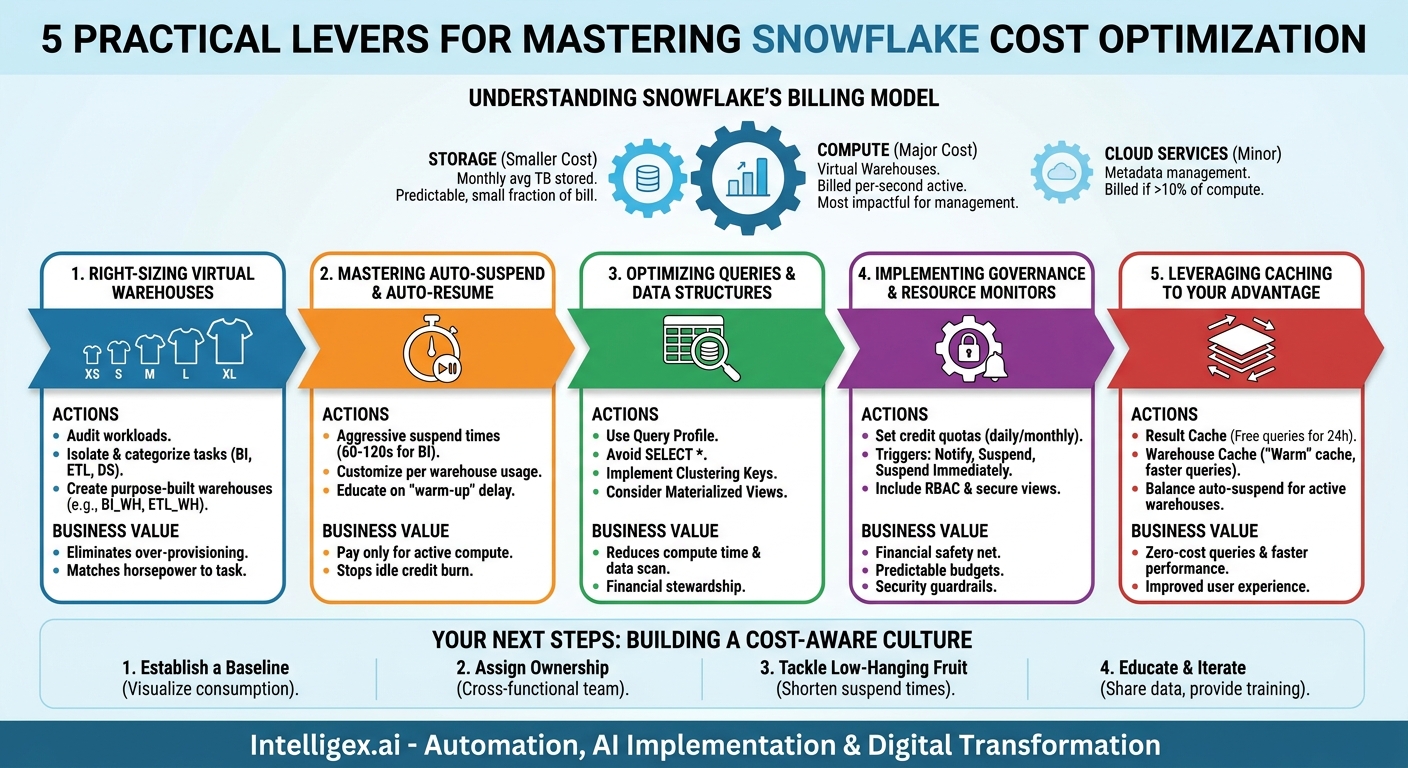
The Snowflake Data Cloud is a powerful engine for business transformation. Its decoupled architecture for storage and compute provides unparalleled scalability and performance, allowing teams from finance to marketing to unlock insights that were once out of reach. But with great power comes a new kind of responsibility: managing a consumption-based pricing model. Unlike traditional on-premise systems with fixed capital expenses, Snowflake costs are variable. This flexibility is a huge advantage, but without careful management, it can lead to surprising bills and budget overruns.
The goal is not simply to slash costs. It is to achieve cost efficiency. This means ensuring every dollar spent on Snowflake compute and storage drives maximum business value, whether that’s accelerating a sales forecast, personalizing a marketing campaign, or optimizing a supply chain. True optimization requires a blend of technical best practices and a cost-aware culture. Here, we break down five fundamental levers you can pull to control your Snowflake spend, turning a potential liability into a strategic asset.
Understanding Snowflake’s Billing Model: Compute vs. Storage
Before you can optimize costs, you must understand what you are paying for. Snowflake’s pricing is refreshingly transparent and boils down to two primary components, with a third, smaller factor to consider.
First is Storage. This is the cost of keeping your data in Snowflake. It is billed monthly based on the average terabytes of data stored per day after compression. Snowflake’s excellent compression means the physical storage footprint is often much smaller than the raw data size. Generally, storage costs are predictable and represent a small fraction of the total bill for most active accounts.
Second, and most importantly, is Compute. This is where the vast majority of your spend will be. You don’t pay for servers that are always on. Instead, you pay for processing power, which is provided by “virtual warehouses.” These are clusters of compute resources that execute your queries, data loads, and transformations. You are billed on a per-second basis (with a 60-second minimum) for the time a warehouse is active and running. When a warehouse is suspended, you pay nothing for it. This compute cost is measured in Snowflake Credits, which are the units of usage. The number of credits consumed depends on the size of the warehouse and how long it runs.
Finally, there are Cloud Services costs. This is a smaller charge for the background work Snowflake does to manage your account, including metadata management, authentication, access control, and query optimization. If this layer’s usage exceeds 10% of your daily compute credit usage, you are billed for the overage. For most well-managed accounts, this is not a significant cost driver, but it is important to be aware of.
By understanding this model, you can see that the most impactful area for cost management is compute. The less time your warehouses run, and the more efficiently they run, the lower your bill will be.
Lever 1: Right-Sizing Your Virtual Warehouses
The single most effective lever for controlling compute cost is ensuring your virtual warehouses are the correct size for the work they are performing. Snowflake offers “T-shirt sizes” for warehouses, from X-Small to 6X-Large. Doubling the size (e.g., from Small to Medium) doubles the compute resources and doubles the credit consumption per hour, but it also means queries will generally run twice as fast.
The common mistake is using one large, general-purpose warehouse for all tasks. This is inefficient. An HR analyst running a quick query on employee headcount doesn’t need the same horsepower as a complex ETL job processing millions of new sales records. Segregating workloads onto different, appropriately sized warehouses is key.
A Step-by-Step Process for Right-Sizing
- Audit Your Current Workloads: Use Snowflake’s administrative views, like `QUERY_HISTORY`, to analyze which types of queries are running. Identify patterns. Are there lots of small, fast queries from a BI tool? Are there periodic, heavy data transformation jobs? Who is running what?
- Categorize and Isolate Workloads: Group tasks by their performance requirements. Common categories include BI and dashboarding (requires high concurrency, low latency), data loading (ETL/ELT), data science and exploration (variable complexity), and ad-hoc analysis.
- Create Purpose-Built Warehouses: Instead of a single “one-size-fits-all” warehouse, create several. For example:
- `BI_WH` (Size: Small or X-Small, multi-cluster): For connecting tools like Tableau or Power BI. Sized for concurrency, not raw power.
- `ETL_WH` (Size: Medium or Large): For scheduled data ingestion and transformation jobs that need to finish quickly.
- `DS_WH` (Size: Large or X-Large): For data science teams running complex modeling queries that are resource-intensive.
- `ADHOC_WH` (Size: Small): For business users running their own occasional queries, with strict resource monitoring.
- Monitor and Adjust: Right-sizing is not a one-time task. Continuously monitor warehouse performance. Key metrics to watch in the `WAREHOUSE_LOAD_HISTORY` view include `AVG_RUNNING` and `AVG_QUEUED_LOAD`. If you see significant queuing, your warehouse may be undersized or need multi-clustering. If it consistently runs queries in seconds and then sits idle, it might be oversized.
Business Scenario (Operations): A supply chain team uses a single Large warehouse for everything. Their dashboards are fast, but the warehouse runs constantly during business hours, costing a fortune. By splitting the work, they create an X-Small warehouse for their dashboards and use the Large warehouse only for the two-hour nightly inventory reconciliation job. The dashboards remain plenty fast, and they’ve eliminated six hours of unnecessary Large-warehouse compute cost every single day.
Lever 2: Mastering Auto-Suspend and Auto-Resume
The auto-suspend feature is your best friend in the fight against wasted compute spend. When enabled, a virtual warehouse will automatically shut down after a specified period of inactivity. When a new query is submitted to a suspended warehouse, it automatically resumes, typically within a second or two. This ensures you only pay for compute resources when they are actively working.
The critical decision point is the suspend time. The default is often 10 minutes, which is almost always too long for intermittent workloads. For every minute a warehouse sits idle waiting to suspend, you are burning credits for nothing. For many BI and ad-hoc query warehouses, an aggressive suspend time of 60 to 120 seconds is far more efficient.
Auto-Suspend Do’s and Don’ts
- Do: Customize the auto-suspend timer for each warehouse based on its specific usage pattern. A data loading warehouse that runs every hour can have a 5-minute timer, while a dashboard warehouse used sporadically should have a 1-minute timer.
- Do: Educate your users. Let them know there might be a one or two-second “warm-up” delay if they are the first to run a query after a period of inactivity. This is a tiny price to pay for massive cost savings.
- Don’t: Set the timer to `NEVER` unless you have an extremely specific, high-SLA use case that cannot tolerate even a one-second startup delay. This is very rare and should be carefully justified.
- Don’t: Assume the default setting is optimal. It is a generic default, not a tailored recommendation. Proactively set it to a lower value and adjust if needed.
Business Value: Aggressive auto-suspension directly translates to cost savings. It enforces the “pay only for what you use” principle at a granular level, eliminating the cost of idle compute and making departmental budgets more predictable and efficient.
Lever 3: Optimizing Queries and Data Structures
A perfectly sized and configured warehouse can still waste money if it is forced to run inefficient queries. A poorly written query can run for minutes (or even hours) when an optimized version could run in seconds. This isn’t just about technical purity; it is about financial stewardship. Every query has a cost, and that cost is amplified by the size of the warehouse it runs on.
Empowering analysts and data engineers to write efficient code is a crucial cost-control measure.
Practical Optimization Tactics
- Use the Query Profile: Before asking to scale up a warehouse, users should first analyze their query in Snowflake’s Query Profile tool. This visual interface breaks down the query execution plan and shows exactly where time is being spent. Often, a bottleneck like an accidental “table scan” or an inefficient `JOIN` can be identified and fixed in the code itself.
- Select Specific Columns: Avoid `SELECT *`. This is a basic but frequently ignored rule. Pulling unnecessary columns increases the amount of data that needs to be processed and moved, which consumes more compute time.
- Implement Clustering Keys: For very large tables (typically multi-terabyte), defining a clustering key can dramatically improve query performance. This physically co-locates related data, allowing Snowflake to prune massive partitions from its scans. A common use case is clustering a large event table by `event_date`, which makes time-based queries lightning fast. For more information on performance tuning, the official Snowflake Documentation is an excellent resource.
- Consider Materialized Views: For complex aggregations and joins that power critical dashboards, a materialized view can be a cost-saver. The results are pre-computed and stored. While there is a small cost to maintain the view, it can be far cheaper than having dozens of users repeatedly run the same resource-intensive query against the raw tables all day.
Business Scenario (Finance): A finance team’s month-end reporting query takes 45 minutes on a Large warehouse. An investigation using the Query Profile reveals that a filter on `transaction_date` is not being used effectively, causing the query to scan years of data. By rewriting the `WHERE` clause and adding a cluster key on the date column, the query execution time drops to under 2 minutes. This not only saves significant credits each month but also allows the team to get their reports faster, accelerating the closing process.
Lever 4: Implementing Governance with Resource Monitors
Optimization is about efficiency, but governance is about control and predictability. Resource monitors are Snowflake’s built-in safety net. They allow you to set credit consumption limits on warehouses or your entire account over a specified time period (e.g., daily, monthly).
When consumption reaches a certain percentage of the quota, a resource monitor can trigger actions:
- Notify: Send an email alert to administrators at, for example, 75% and 90% of the quota.
- Notify & Suspend: Send an alert and suspend the assigned warehouses at 100% of the quota. This stops all queries on those warehouses but allows them to be resumed manually.
- Notify & Suspend Immediately: Send an alert and suspend the warehouses, canceling any queries that are currently running. This is a hard stop to prevent any further cost overrun.
Implementing resource monitors is non-negotiable for any production Snowflake account. They provide a crucial layer of financial protection against runaway queries, buggy code, or accidental user behavior.
A Note on Governance for Sensitive Data and AI
Just as resource monitors provide financial guardrails, data governance provides security and privacy guardrails. This is especially critical when dealing with sensitive information (e.g., PII from HR or customer data) or when using data to train AI and machine learning models.
Effective governance in Snowflake is built on strong role-based access control (RBAC). Define roles with the principle of least privilege in mind. A marketing analyst should have access to aggregated sales data but not the underlying customer contact information. Use secure views and data masking policies to protect sensitive columns, allowing users to query tables without exposing raw PII. When preparing data for an AI model, this same practice ensures the model is trained only on the necessary features, minimizing privacy risks and supporting compliance with regulations like GDPR and CCPA.
Lever 5: Leveraging Caching to Your Advantage
Snowflake employs several layers of caching, and understanding how they work can lead to “free” or significantly cheaper queries. When a query is executed, Snowflake looks for ways to avoid expensive computation.
Result Cache: This is the most powerful layer. If you execute the exact same query that someone else has run in the last 24 hours (and the underlying data has not changed), Snowflake will simply return the cached result. This takes milliseconds and, most importantly, uses zero compute credits. This is a huge benefit for popular dashboards where many users look at the same data.
Warehouse Cache: Each virtual warehouse maintains a local cache of data on its SSDs from queries it has recently executed. If a subsequent query needs some of the same data, it can be read from this incredibly fast local cache instead of fetching it from remote cloud storage. This makes the query run much faster and consume fewer credits.
This behavior creates an interesting trade-off with the auto-suspend setting. An aggressive 60-second suspend timer saves money on idle time but means the warehouse cache is cleared every time it suspends. For a BI warehouse that is queried constantly throughout the business day, setting a slightly longer suspend time (e.g., 5 or 10 minutes) might be more cost-effective. The warehouse stays “warm,” keeping its cache active, which speeds up subsequent queries and reduces their cost. The key is to analyze your specific query patterns to find the right balance.
Business Scenario (Sales): The entire sales team hits refresh on the “QTD Leaderboard” dashboard every morning. The first query of the day is run by the VP of Sales at 8:00 AM. It takes 10 seconds. For the next 24 hours, every other salesperson who loads that exact same dashboard gets the results back instantly from the Result Cache, consuming zero compute credits and providing a fantastic user experience.
Your Next Steps: Building a Cost-Aware Culture
Snowflake cost optimization is not a one-time, set-it-and-forget-it task. It is a continuous process of monitoring, adjusting, and educating. Technology and best practices provide the tools, but lasting success comes from building a culture where everyone who uses the platform feels a sense of ownership over its efficiency.
Here is a simple plan to get started:
- Establish a Baseline: Dive into Snowflake’s `ACCOUNT_USAGE` schema. Build a simple dashboard to visualize your credit consumption by warehouse, by day, and by user. You cannot optimize what you cannot measure.
- Assign Ownership: Form a small, cross-functional team to lead this initiative. Include a data engineer who understands the technical side, a finance partner who can track the budget impact, and a power user from a key business unit.
- Tackle Low-Hanging Fruit: Begin with the simplest, most impactful changes. Review all warehouse auto-suspend timers and shorten them. Identify your most expensive queries and see if they can be quickly optimized.
- Educate and Empower Users: Share cost and performance data with the teams writing the queries. When an analyst can see that their query cost $50 to run, they are naturally incentivized to find a more efficient way to get their answer. Provide them with training on query optimization and best practices.
- Review and Iterate: Schedule a monthly meeting to review your cost dashboards, discuss what’s working, and identify new areas for improvement. As your data and use cases evolve, so too should your optimization strategy.
By implementing these five levers and fostering a culture of accountability, you can transform your Snowflake spend from a source of concern into a well-managed, high-value investment that powers your business forward.
Your Next Read:
Category:
Get a FREE
Proof of Concept
& Consultation
No Cost, No Commitment!
