

The boardroom conversation around artificial intelligence has shifted. We are no longer in the era of “what if”; we are in the era of “how much”. While launching an AI pilot is relatively easy, securing long-term funding requires moving past “gut feelings” to a solid, data-backed business case. According to recent estimates, more than 80% of AI projects fail—not because the technology is broken, but because of misaligned goals, poor data, and a lack of clear ROI metrics.
To gain executive approval, you need to present solid financial projections, account for hidden costs, and avoid the “vanity metrics” that CFOs tend to ignore. This guide provides a practical, five-part framework to calculate the true return on investment for your automation projects.
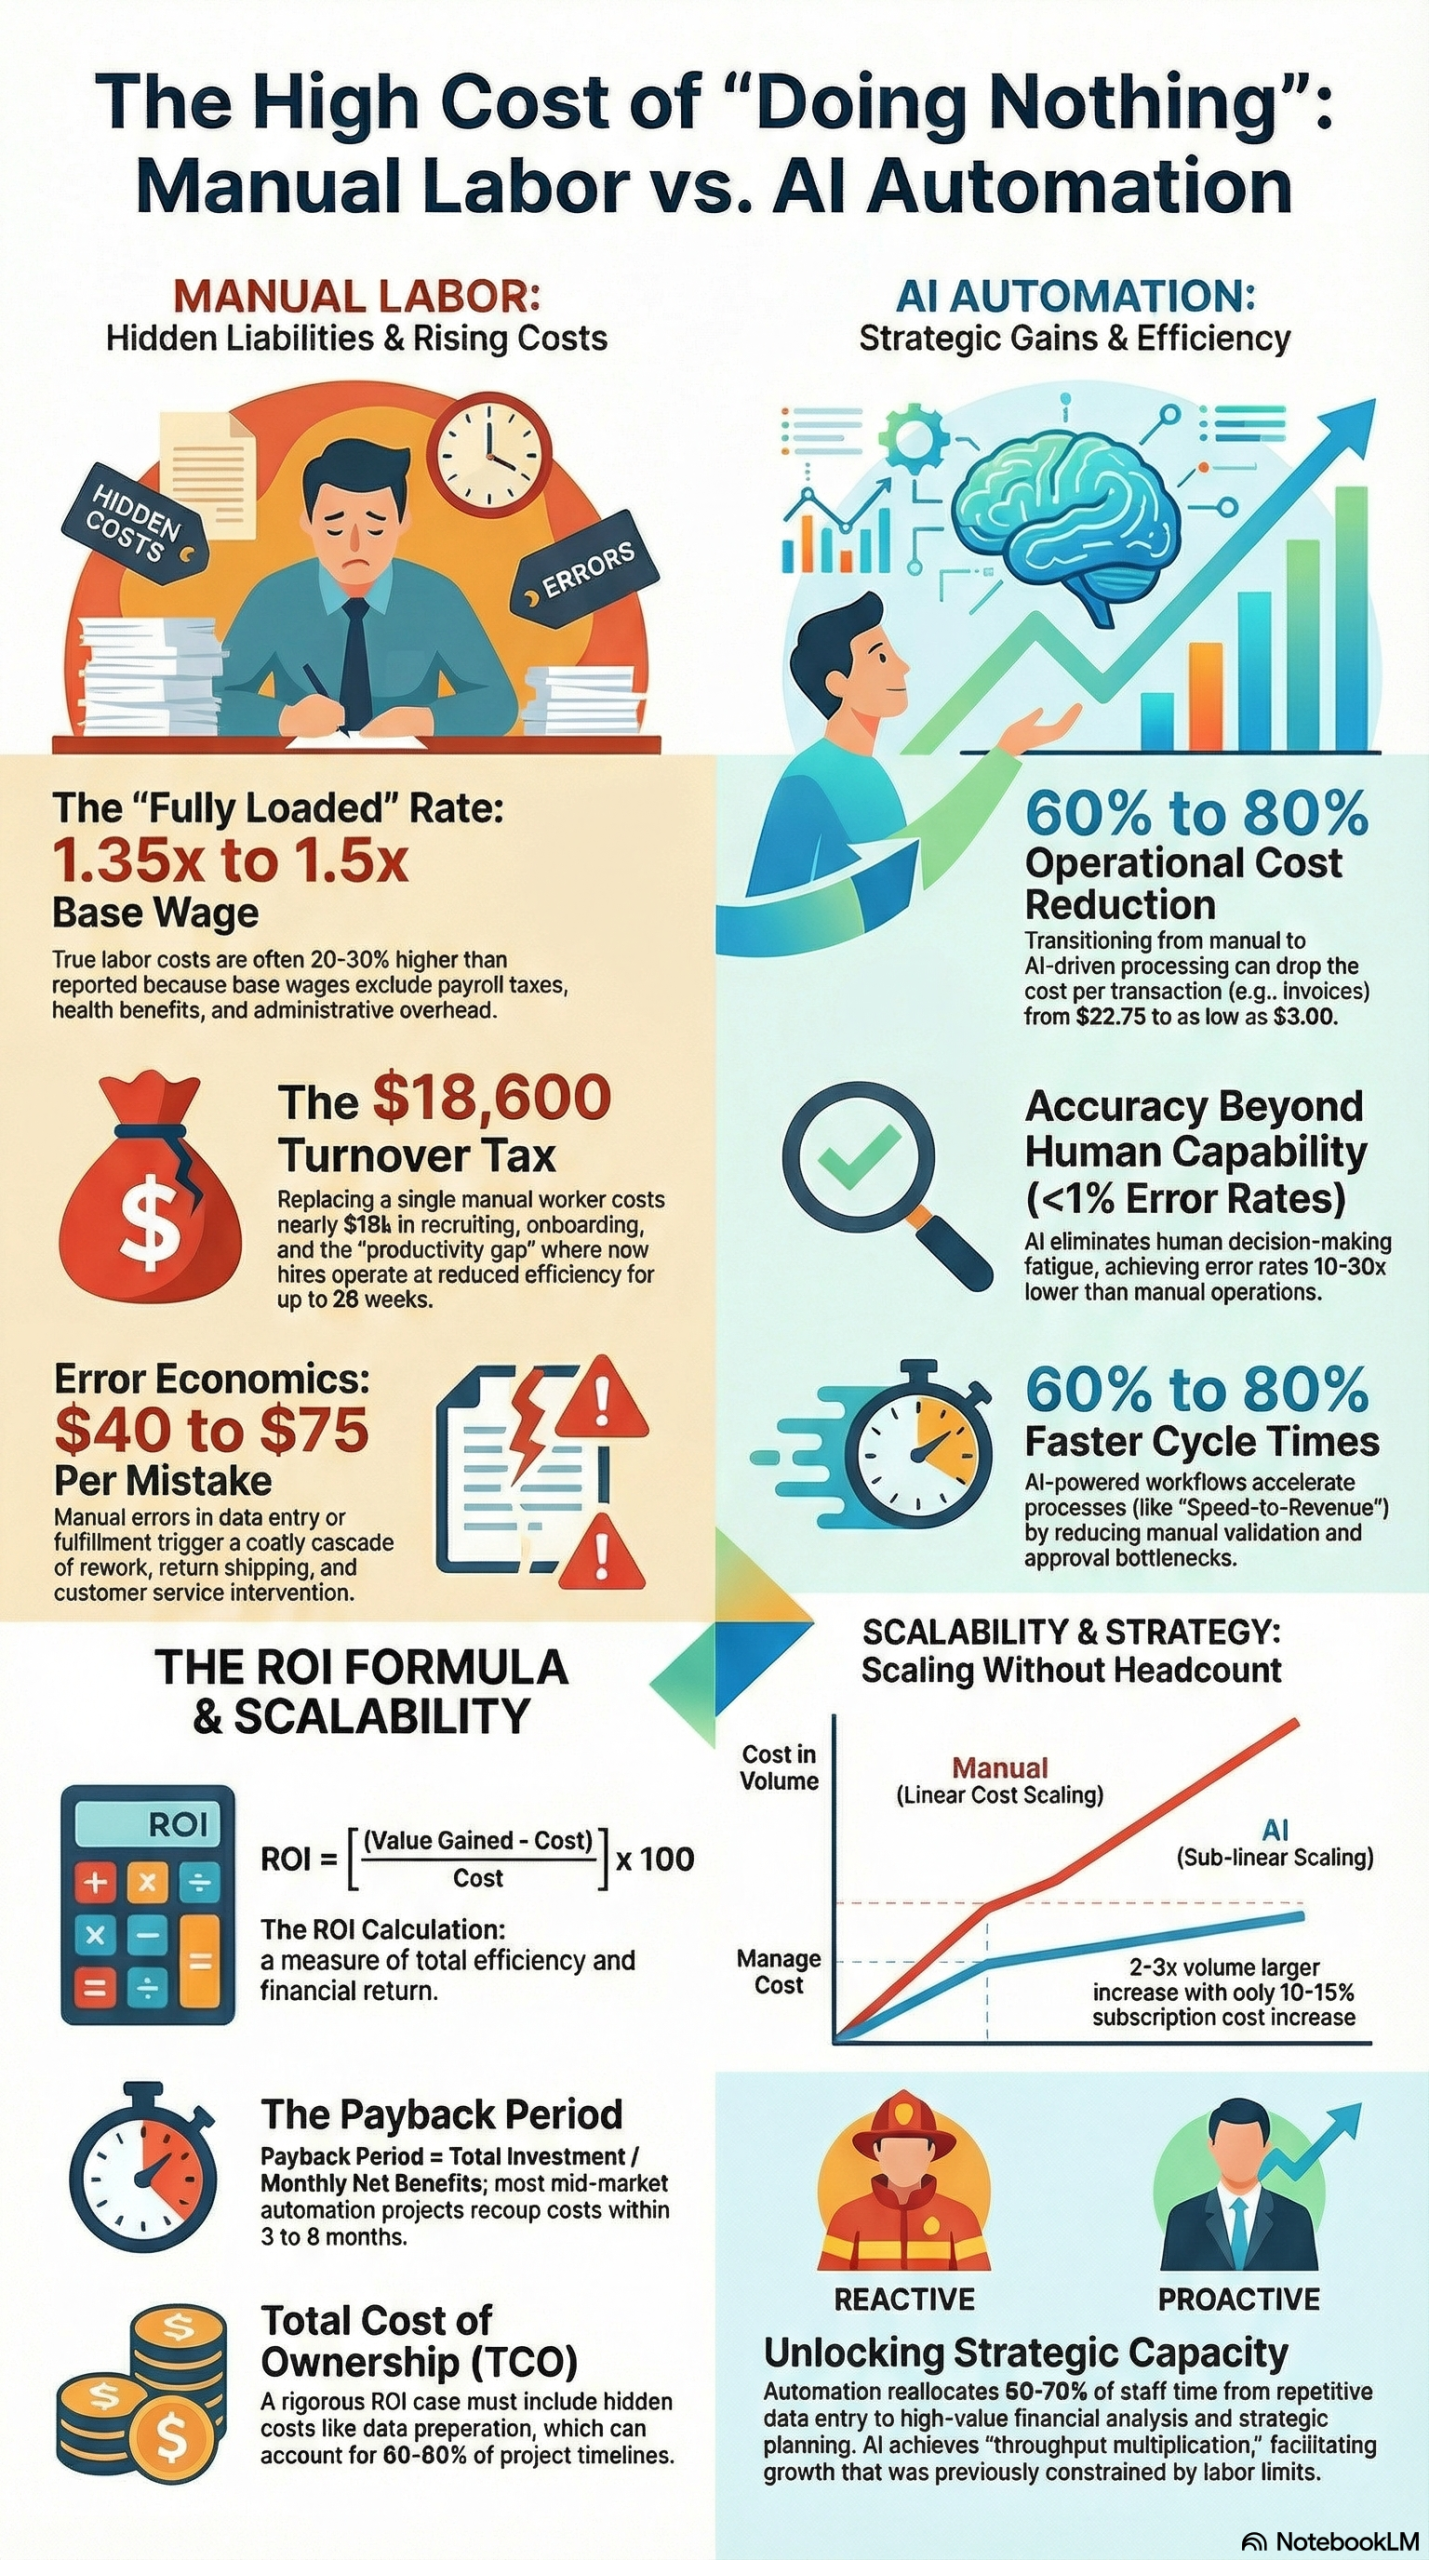
1. The Real Cost of “Doing Nothing”
A common mistake in operational planning is assuming that manual processes are “free” because they don’t require immediate software spend. In reality, manual labor is one of the most volatile and expensive components of your business.
The “Fully Loaded” Rate
When building your baseline, do not use base wages. This practice underestimates true costs by 20% to 30%. You must use a fully loaded labor rate, which includes:
- Base Hourly Wage: $1.00x
- Benefits & Taxes: $1.35x to $1.42x
- Administrative Overhead: $1.50x
A worker earning a $20/hour wage actually costs your enterprise between $27 and $35 per hour.
The Attrition Trap
Manual workflows are tied to high turnover rates, averaging 46% to 49% annually in sectors like fulfillment. The cost to replace a single manual worker is approximately $18,600, including recruiting, background checks, and the “productivity gap” while a new hire ramps up. Automation breaks this cycle by centralizing knowledge in a system that doesn’t quit.
2. The 5-Part ROI Framework
To build a defensible business case, break your ROI into these five independently calculated components.
I. Time Savings: Hours × Cost × Frequency
This is the bedrock of most proposals. The formula is: (Hours Saved per Task × Frequency per Year) × Fully Loaded Hourly Rate.
- Example: If an AI tool saves 10 hours per week at a $75/hour fully loaded rate, that is $39,000 in annual savings per person.
- Practical Tip: Do not promise 100% adoption on day one. Model adoption as a gradual S-curve, starting at 30% and ramping up over 12 months.
II. Error Reduction: Cost of Mistakes × Improvement Rate
Manual data entry can have error rates as high as 4.8%, while complex tasks can hit 20%. AI-powered systems can slash these rates to less than 1%. Calculate this by taking the (Current Error Rate – New Error Rate) × Transaction Volume × Fix Cost. The “fix cost” should include rework, penalties, and lost customers. In fulfillment, the full cost of a single order error (including return shipping and customer service time) ranges from $40 to $75.
III. Speed-to-Revenue: Faster Cycles × Deal Value
AI can shorten sales cycles and improve lead conversion. Predictive lead scoring can increase the volume of qualified leads by 30–50%.
- The Math: (Incremental Qualified Leads × Conversion Rate × Average Order Value). Shorter cycles mean faster cash flow. In accounts payable, faster processing (1–3 days vs. 7–14 days) allows companies to capture early payment discounts, typically 2% of the invoice value.
IV. Capacity Unlock: Redirecting Human Intelligence
Instead of asking “how many people can we replace?”, ask “how much faster and more scalable can we become?”. Automation allows you to handle volume spikes—such as peak holiday seasons—without hiring temporary staff that cost 1.4x to 1.75x more than permanent employees. Calculate the value of additional throughput: (Additional Units Processed × Value per Unit).
V. Competitive Advantage: The Intangibles
While harder to quantify, metrics like reduced churn, better brand reputation (measured via Net Promoter Scores), and faster product launches are critical. Use conservative proxy metrics to show how these “soft” benefits compound over time.
3. Factoring in the Hidden Costs
CFOs will immediately spot a proposal that ignores ongoing expenses. To maintain credibility, you must include the “hidden 70%” of the total investment.
Implementation and Data Prep
Data preparation typically accounts for 60% to 80% of your project timeline. Raw data is rarely “AI-ready” and requires cleaning, labeling, and restructuring, which can cost between £80,000 and £300,000 for an enterprise project.
Ongoing Maintenance
AI models are not “set it and forget it.” You must budget for:
- Model Retraining and Monitoring: 10% to 30% of your annual budget.
- Change Management: Training workshops and productivity dips during the transition typically consume 20% to 40% of the total budget.
- Cloud Infrastructure: Fees for data storage and compute can escalate as volume grows.
4. Real-World Benchmarks: What Success Looks Like
Based on industry data, here is what a realistic ROI looks like across different sectors:
| Use Case | Annual Benefits | First-Year Costs | ROI (Year 1) | Payback Period |
|---|---|---|---|---|
| Finance (Invoice Processing) | $78,300 | $25,000 | 213% | 3.8 Months |
| Customer Service (Tickets) | $195,296 | $56,000 | 249% | 3.4 Months |
| Manufacturing (Quality Control) | $785,000 | $210,000 | 274% | 3.2 Months |
Best-in-class accounts payable departments using AI spend just $2–$4 per invoice, whereas manual processing averages $12–$22.75.
5. Decision Framework: Traditional vs. Agentic AI
Not every process needs a sophisticated AI.
- Traditional Automation (RPA): Best for stable, high-volume, rules-based tasks like payroll or simple invoice generation.
- Agentic AI: Best for processes with high variability and unstructured data (emails, legal documents, images).
While Agentic AI has a higher implementation cost (often requiring 50% more developer hours), it drastically reduces exception handling costs. In a customer support triage scenario, traditional automation might struggle with a 7% exception rate, whereas Agentic AI can lower that to 1.5% by “reasoning” through the data. This can save thousands of dollars monthly in manual oversight costs.
6. How to Get Started (Practical Steps)
- Select a Pilot Project: Choose a high-impact, low-risk process (e.g., document processing).
- Establish Baselines: Collect 8 to 12 weeks of data on current time, costs, and error rates. You cannot measure improvement without a baseline.
- Use Scenario Modeling: Create “Base,” “Optimistic,” and “Conservative” assumptions.
- Implement a “Kill Switch”: Demonstrate fiscal responsibility by including a 30-day evaluation cycle with clear decision points to scale, fix, or terminate the project.
- Calculate the Payback Period: Total Investment ÷ Monthly Net Benefits. Aim for a payback period of 6 to 18 months to satisfy the boardroom.
Conclusion
Building a business case for AI is no longer about the “hype” of the technology; it is about the financial architecture of operational excellence. By using fully loaded rates, accounting for the “productivity gap” of human labor, and factoring in recurring maintenance costs, you can turn your AI initiative from an experimental expense into a strategic growth lever.
Ready to calculate your own ROI? Use the formula: ROI = (Value Gained – Total Cost) ÷ Total Cost × 100. Stick to conservative assumptions, and you will build a business case that stands up to even the most rigorous executive scrutiny.
Your Next Read:
Category:
Get a FREE
Proof of Concept
& Consultation
No Cost, No Commitment!
