

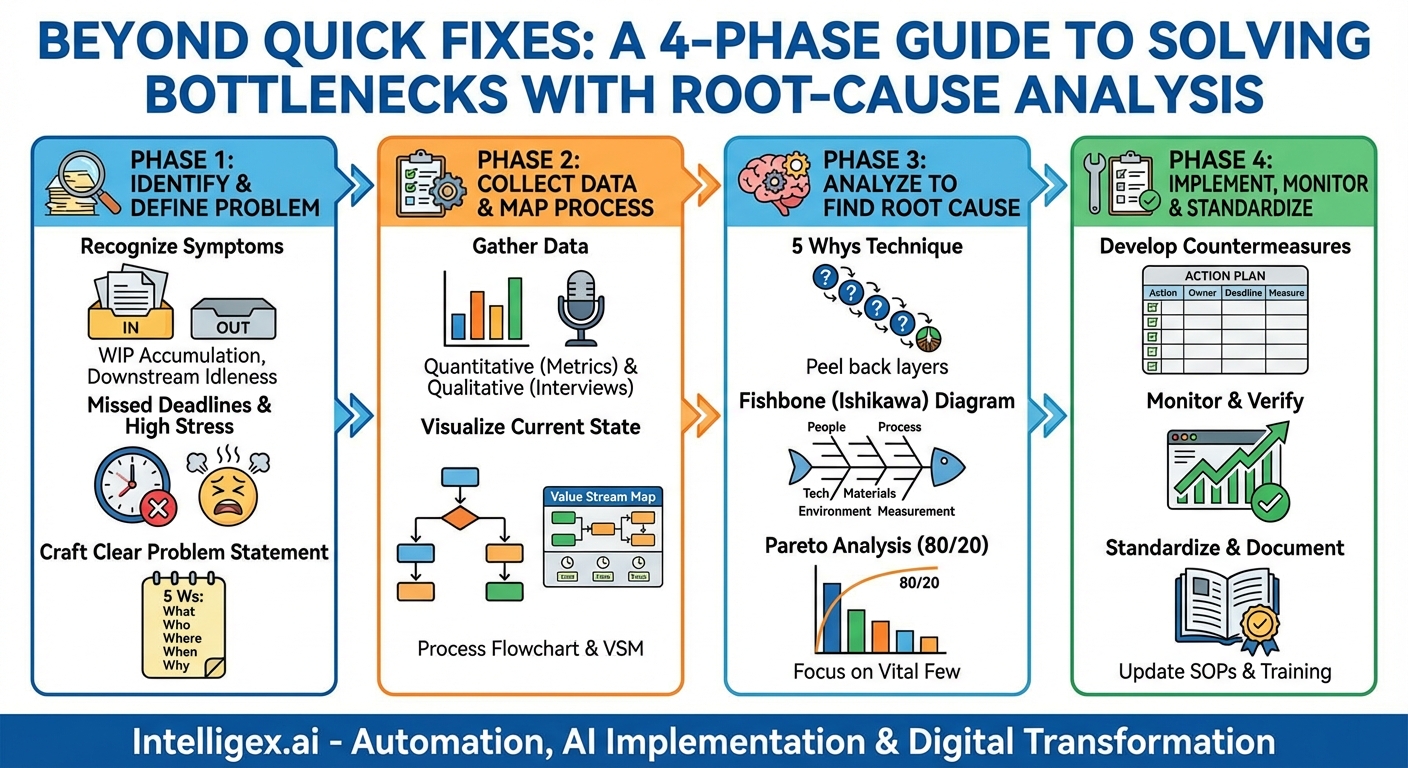
In any operation, whether it’s a software development pipeline, a manufacturing assembly line, or a customer service workflow, bottlenecks are the silent killers of productivity. They are the frustrating choke points where work piles up, downstream processes are starved for input, and deadlines become aspirational rather than achievable. Like a traffic jam on a major highway, a single bottleneck can have ripple effects that bring the entire system to a grinding halt. The common reaction is to throw more resources at the problem—more people, more powerful machines, more overtime. But this is often like trying to fix a leaky pipe by simply increasing the water pressure. It might provide temporary relief, but it doesn’t address the fundamental crack causing the leak. To truly solve an operational bottleneck, you must go deeper than the surface-level symptoms and uncover the root cause. This is where a structured Root-Cause Analysis (RCA) flow becomes not just a useful tool, but an essential business process.
Root-Cause Analysis is a systematic method for problem-solving that aims to identify the foundational reason for a failure or a defect. Instead of simply treating the symptoms, RCA drills down to the origin of the problem so that you can implement solutions that prevent it from ever happening again. When applied to operational bottlenecks, this approach transforms your team from reactive firefighters into proactive process architects. This post outlines a comprehensive, four-phase flow for conducting RCA on operational bottlenecks, providing a repeatable framework to enhance efficiency, reduce waste, and build more resilient systems.
Phase 1: Identify and Define the Problem with Precision
You can’t solve a problem you don’t fully understand. The first phase is about moving from a vague feeling that “things are slow” to a concrete, data-supported problem statement. It’s the diagnostic phase, where you pinpoint exactly where the pain is and what it looks like.
Recognizing the Symptoms
Bottlenecks rarely announce themselves explicitly. Instead, they manifest through a series of symptoms. Learning to recognize these signs is the first step. Look for:
- Work-in-Progress (WIP) Accumulation: Is there one specific stage in your workflow where tasks or materials consistently pile up? This is the most classic indicator. For example, in a software team, you might see a mountain of “Ready for QA” tickets while the “In Progress” column for development is nearly empty.
- Downstream Idleness: Are teams or machines further down the process frequently waiting for work? If your packaging department is constantly waiting for products to arrive from the assembly line, the bottleneck is likely in assembly.
- Consistently Missed Deadlines or High Cycle Times: If the total time it takes to complete a process from start to finish is increasing, a bottleneck is often the culprit. Track your cycle times; a spike or a consistently high number points to a constraint in the system.
- High Stress and Burnout: The team or individual managing the bottleneck process often feels immense pressure. They are overworked, constantly behind, and may have a higher rate of errors due to the strain. This is a critical qualitative indicator.
Crafting a Clear Problem Statement
Once you’ve identified the general area of the bottleneck, you must define it with absolute clarity. A weak problem statement like “The approval process is slow” is not actionable. A strong problem statement is specific, measurable, and free of assumptions about the cause. Use the 5 Ws (Who, What, Where, When, Why) to frame it:
- What is the specific problem? (e.g., The time to get a marketing campaign brief approved.)
- Who is affected? (e.g., The content creation team and campaign managers.)
- Where in the process does it occur? (e.g., At the final legal review stage.)
- When does it happen? (e.g., Consistently over the last quarter, especially for campaigns involving video assets.)
- What is the impact? (e.g., It delays campaign launches by an average of 7 business days, impacting quarterly revenue goals.)
A resulting strong problem statement would be: “Over the last quarter (Q3), the legal review stage for marketing campaign briefs involving video assets has delayed campaign launches by an average of 7 business days, causing downstream scheduling conflicts for the content team and risking our lead generation targets.” This gives your investigation a clear, focused starting point.
Phase 2: Collect Data and Map the Process
With a clear problem defined, you must resist the urge to immediately brainstorm solutions. Doing so without data is just guessing. This phase is about gathering objective evidence to understand the full context of the bottleneck.
Gathering Quantitative and Qualitative Data
A robust analysis relies on a mix of hard numbers and human experience.
- Quantitative Data (The ‘What’): This is the measurable evidence. Collect metrics like cycle time per process step, throughput (units completed per hour/day), error rates at each stage, and the size of the queue before the bottleneck. System logs, project management tools, and time-tracking software are invaluable sources.
- Qualitative Data (The ‘Why’ and ‘How’): This is the human context that numbers alone can’t provide. Conduct interviews with the people involved in the process—both upstream and downstream of the bottleneck. Use open-ended questions: “Can you walk me through your process?” “What are your biggest frustrations?” “What do you think is slowing things down?” Observe the process in action to see how it *actually* works, not just how the official documentation says it should.
Visualize the Current State
You cannot improve a process you cannot see. Visualizing the workflow is non-negotiable. Two powerful tools for this are:
- Process Flowchart: A simple flowchart that maps out every step, decision point, and handover in the process. This helps everyone involved get on the same page and often immediately highlights unnecessary loops, redundancies, or overly complex pathways.
- Value Stream Map (VSM): A more advanced tool that not only maps the process steps but also layers critical data onto it. A VSM includes the time taken for each step (both value-added time and waiting time), the number of people involved, and the flow of information. This is exceptionally effective for bottlenecks, as it visually separates the time work is actively being done from the time it is sitting in a queue—often revealing that the majority of the cycle time is just waiting.
This visualization, backed by your collected data, will confirm the exact location of the bottleneck and quantify its impact, setting the stage for a deep analysis.
Phase 3: Analyze the Data to Find the Root Cause
This is the heart of RCA. Armed with a clear problem statement and objective data, you can now move beyond the symptoms and use structured techniques to drill down to the foundational cause.
The 5 Whys Technique
This beautifully simple technique, pioneered by Toyota, involves repeatedly asking “Why?” to peel back the layers of a problem. It forces you to move beyond surface-level explanations.
Problem: The final QA testing for our software release is consistently taking 3 days longer than planned, creating a bottleneck.
1. Why? Because the QA team is finding an unexpectedly high number of bugs in the final build.
2. Why? Because the bugs being found are complex integration issues between different modules.
3. Why? Because the integration testing is only happening at the very end of the development cycle.
4. Why? Because our development workflow doesn’t have a dedicated continuous integration (CI) environment for early testing.
5. Why? Because we haven’t prioritized the budget and engineering time to set up a proper CI/CD pipeline. (Root Cause)
Notice the solution is not “hire more QA testers” (addressing symptom 1) but “invest in a CI/CD pipeline” (addressing the root cause).
Fishbone (Ishikawa) Diagram
When a problem is more complex with multiple potential causes, a Fishbone Diagram is an excellent tool for structured brainstorming. The problem statement forms the “head” of the fish. The “bones” represent categories of potential causes. Common categories include:
- People: Lack of training, communication issues, insufficient staffing.
- Process: Inefficient workflows, no standard operating procedures, unnecessary approvals.
- Technology: Outdated software, slow hardware, system integration failures.
- Materials: Poor quality inputs, incorrect information provided.
- Environment: Physical workspace issues, regulatory constraints.
- Measurement: Incorrect data, lack of performance metrics.
Your team brainstorms potential causes within each category, using the data collected in Phase 2 to validate or discard them. This provides a holistic view of all the contributing factors.
Pareto Analysis (The 80/20 Rule)
Often, your analysis will uncover multiple root causes. How do you prioritize? Pareto Analysis helps you focus on the vital few. It’s based on the principle that roughly 80% of the effects come from 20% of the causes. Create a chart that lists the identified causes and the frequency or impact of each. For instance, you might find that out of ten types of errors causing a bottleneck, two of them account for 85% of the total delay. This tells you exactly where to focus your improvement efforts for the greatest return.
Phase 4: Implement, Monitor, and Standardize the Solution
Identifying the root cause is a victory, but it’s meaningless without effective action. The final phase is about implementing a solution and ensuring it sticks.
Develop and Implement Countermeasures
For each identified root cause, brainstorm a specific countermeasure. The best solutions are targeted, measurable, and directly address the root cause, not the symptoms. Create a clear action plan:
- What is the specific action to be taken? (e.g., “Purchase and implement Jenkins for a CI server.”)
- Who is responsible for implementing it? (e.g., “The DevOps team lead.”)
- When is the deadline for completion? (e.g., “End of Q4.”)
- How will we measure success? (e.g., “Reduce bugs found in final QA by 50%.”)
Monitor and Verify
Once a solution is implemented, the job is not done. You must rigorously monitor the process using the same metrics you collected in Phase 2. Did the cycle time decrease? Has the queue at the bottleneck shrunk? Is downstream idleness reduced? This step is crucial for verifying that your solution actually worked. It also helps you spot any unintended negative consequences of the change.
Standardize and Document
If the solution is successful, the final step is to standardize it. Update your process documentation, create new standard operating procedures (SOPs), and provide training to ensure everyone follows the new, improved workflow. This prevents the organization from slipping back into old habits and locks in the gains you’ve made. It also establishes a new baseline for future continuous improvement efforts, embodying the spirit of the Plan-Do-Check-Act (PDCA) cycle.
By adopting this structured Root-Cause Analysis flow, you move beyond the frustrating cycle of quick fixes and recurring problems. You empower your teams to become scientific problem-solvers, methodically dissecting operational bottlenecks and implementing robust, lasting solutions. It is a cultural shift that pays dividends in efficiency, employee morale, and ultimately, the bottom line. The next time you see a pile of work growing, don’t just see a problem—see an opportunity to make your entire operation stronger from its very foundation.
Your Next Read:
Category:
Get a FREE
Proof of Concept
& Consultation
No Cost, No Commitment!
