

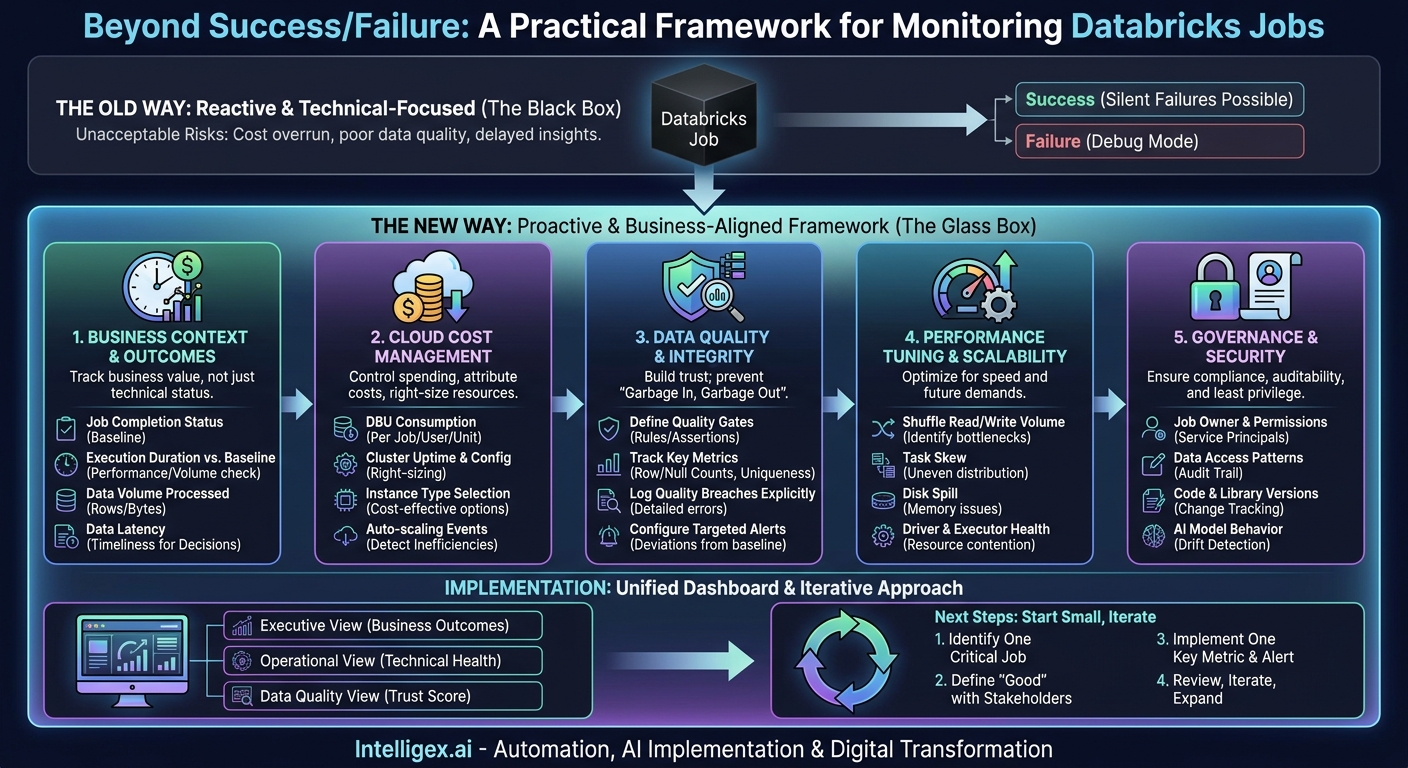
A critical Databricks job fails silently overnight. The next morning, your finance team presents a quarterly forecast to leadership using stale, incomplete data. This isn’t a hypothetical technical problem. It’s a business risk that undermines trust in your data platform and leads to poor decisions. Without a deliberate monitoring strategy, your Databricks jobs are effectively black boxes, creating unacceptable risks around cost, data quality, and speed.
Effective monitoring is not about collecting every possible log file. It’s about connecting technical performance metrics to the business outcomes they support. It transforms the conversation from “the job failed” to “the sales team’s hourly performance dashboard is delayed, and here’s why.” This post provides a practical framework for what to track in your Databricks jobs, focusing on metrics that deliver tangible business value through improved cost control, data reliability, and operational visibility.
Beyond “Success” or “Failure”: The Business Context of Job Status
The most basic metric, job status, is often a misleading indicator of value. A job can finish with a “Success” status yet still fail the business in crucial ways. A job that runs successfully but processes zero new records is a silent failure. A job that completes hours behind schedule misses the window where its data is useful. To make monitoring meaningful, we must frame it around the business process each job serves.
Consider a job that aggregates daily sales data for a C-level dashboard. The business SLA is that data must be fresh by 8:00 AM. In this context, a “successful” run that finishes at 10:30 AM is a failure. Similarly, if a marketing automation job runs “successfully” but ingests a corrupted customer list, it has failed its business purpose and may even cause damage by sending incorrect communications.
To move beyond simple pass/fail monitoring, you need to track metrics that reflect the job’s true business contribution:
- Job Completion Status: The baseline metric (Succeeded, Failed, Canceled, Skipped). This is the starting point, not the end.
- Execution Duration vs. Baseline: Track the job’s runtime against its historical average. A sudden, significant increase in duration, even in a successful run, is an early warning sign of performance degradation, data volume changes, or infrastructure issues.
- Data Volume Processed: Measure the number of rows or bytes read and written. If a daily job that typically processes one million records suddenly processes only one thousand, it requires immediate investigation, even if it completes successfully. This can indicate an upstream data delivery problem.
- Data Latency: This is the total time from when the source data becomes available to when the transformed data is ready for consumption. High latency directly impacts the timeliness of business decisions. For an operations team relying on real-time inventory data, low latency is non-negotiable.
By tracking these metrics, you shift from a reactive, technical-focused approach to a proactive, business-aligned one. The conversation changes from debugging a failed task to ensuring the revenue-reporting pipeline meets its service-level objectives.
Taming Cloud Costs: Monitoring Cluster and Resource Utilization
Without careful oversight, the convenience and power of Databricks can lead to significant and unexpected cloud spending. Every job run consumes resources, and those resources have a direct cost. Monitoring resource utilization is not just an IT task, it is a core financial governance function for any organization investing in data and AI.
The business value is clear: cost control, predictable budgeting, and a higher return on your data platform investment. When you can attribute costs directly to specific projects, teams, or business units, you can have informed conversations about value and efficiency. For example, the finance department can work with the data team to understand why the cost of running marketing analytics jobs has doubled, and then decide if the business value justifies the expense.
Key Cost Metrics to Monitor
To get a handle on spending, focus on the primary drivers of Databricks costs:
- DBU Consumption: The Databricks Unit (DBU) is a normalized measure of processing capability consumed per hour. This is the most important metric for understanding your Databricks bill. You must track DBU consumption per job, per user, and per business unit. This allows you to identify your most expensive workloads and optimize them first.
- Cluster Uptime and Configuration: A job’s cost is a function of how long its cluster runs and what resources that cluster uses. Monitor the total uptime for job clusters. Are you using an expensive, oversized cluster for a simple, short-running task? This is a common source of waste. Consider “right-sizing” clusters for specific workload types.
- Instance Type Selection: The virtual machine instances used for your cluster have different price points. Monitor whether jobs are using cost-effective options where appropriate. For example, using AWS Graviton-based instances or leveraging spot instances for fault-tolerant workloads can significantly reduce costs. Your monitoring should confirm these policies are being followed.
- Auto-scaling Events: Auto-scaling is a powerful feature for handling variable loads, but it can also mask inefficiencies. If a cluster is constantly scaling up and down, it might indicate an inefficient job design or data skew that is causing resource contention. Monitoring these events helps you find jobs that need performance tuning.
A common pitfall is the “one-size-fits-all” cluster policy. Providing teams with a single, large, all-purpose cluster for all their jobs is convenient but extremely wasteful. Proactive monitoring of these metrics provides the data needed to enforce policies for right-sizing clusters, promoting a culture of cost-awareness among your data teams.
Ensuring Data Quality and Integrity
A fast, cost-effective data pipeline is worthless if the data it produces is incorrect. The “Garbage In, Garbage Out” principle is amplified in automated systems, where bad data can propagate silently across dozens of downstream reports, dashboards, and machine learning models. Monitoring for data quality isn’t an optional add-on; it’s a fundamental requirement for building trust in your data.
The business impact of poor data quality is severe. An e-commerce team using flawed sales data might make poor inventory decisions, leading to stockouts or overstocking. An HR analytics job that incorrectly processes employee data could lead to errors in payroll or compliance reporting. Integrating data quality checks and monitoring directly into your Databricks jobs is the best defense.
Here is a step-by-step process for embedding data quality monitoring into your jobs:
- Define and Implement Quality Gates: Within your job’s code, define explicit data quality rules. These are assertions about your data that must be true. For instance, a `customer_id` field must never be null, or an `order_total` must always be a positive number. You can use libraries like PyDeequ or write simple assertions using Spark DataFrame operations.
- Track Key Quality Metrics: Don’t just check for “bad” data; measure the “good” data too. Log metrics that provide a profile of your data on every run. This creates a historical baseline that makes it easy to spot anomalies.
- Log Quality Breaches Explicitly: When a quality check fails, do more than just fail the job. Log a detailed, human-readable message explaining which rule was broken and ideally, include a sample of the invalid data. This dramatically reduces the time it takes to diagnose and fix the root cause.
- Configure Targeted Alerts: Send alerts when quality metrics deviate significantly from their baseline. A 5% increase in null values in a critical column should trigger a notification to the responsible data steward or business analyst, not just the on-call engineer.
Concrete Quality Metrics to Track
- Row Counts: Compare the number of input rows to output rows to detect unexpected data loss.
- Null Counts: Track the percentage of null values in key columns. A sudden spike is a major red flag.
- Uniqueness and Cardinality: For fields that should be unique (like a primary key), monitor the count of distinct values. A drop could signal duplicate data is being introduced.
- Distributional Metrics: For numerical data, track basic statistics like min, max, and standard deviation. An `order_date` field with a max date in the future indicates a serious data entry or processing error.
- Validation Pass/Fail Rate: Track the number of records that pass or fail your defined quality gates. This provides a high-level health score for your data pipeline.
Performance Tuning for Speed and Scalability
Job performance monitoring is about ensuring your data pipelines are not only fast today but can also scale to meet future demands. Slow jobs delay business insights, miss service-level agreements (SLAs), and often cost more to run as they hold onto expensive cluster resources for longer. By monitoring the internal mechanics of your Spark jobs, you can pinpoint bottlenecks and optimize for both speed and efficiency.
The business value is direct: faster access to data allows for more agile decision-making. For a marketing team running campaign analysis, cutting a job’s runtime from four hours to 30 minutes means they can iterate on strategy within the same business day. For IT, a scalable architecture means data volume can grow 10x without requiring a 10x increase in cloud spend.
To diagnose performance issues, you need to look beyond total duration and examine what Spark is doing under the hood. The Spark UI is an excellent tool for real-time diagnostics, but for long-term monitoring and trend analysis, you should extract and log these key performance indicators:
- Shuffle Read/Write Volume: Shuffling is the process of redistributing data across partitions, often required for joins and aggregations. It is one of the most expensive operations in Spark. High shuffle I/O is a primary indicator of an inefficient query plan. Monitoring this metric helps you identify jobs that need optimization, such as by using broadcast joins for smaller tables or improving data partitioning.
- Task Skew: This occurs when data is not evenly distributed across partitions, causing some tasks to take much longer than others. The job can only complete as fast as its slowest task. You can measure skew by looking at the duration distribution of tasks within a stage (e.g., the max task time vs. the median task time). High skew points to a need for repartitioning or addressing skewed keys.
- Disk Spill: When a Spark task does not have enough memory to hold the data it’s processing, it “spills” that data to disk. This is extremely slow compared to in-memory operations. Monitoring the amount of data spilled to disk is a clear signal that you either need to provide more memory to your executors, rewrite the code to be more memory-efficient, or increase the number of partitions.
- Driver and Executor Health: The Spark driver orchestrates the job, while executors perform the actual work. A bottlenecked driver (high CPU or low memory) can bring an entire job to a halt, no matter how many executors you have. Similarly, failing executors can cause delays and retries. Monitor the CPU, memory, and garbage collection metrics for both driver and executor nodes.
For more detailed guidance on diagnosing and addressing these issues, the official Databricks Documentation is an invaluable resource for understanding the Spark UI and performance tuning concepts.
Governance and Security in Automated Jobs
Automated Databricks jobs are powerful agents acting on your organization’s behalf. They often access, process, and transform sensitive customer data, financial records, and proprietary information. Treating job monitoring purely as a performance or cost issue misses a critical third dimension: security and governance. Without proper oversight, these automated processes can become a significant compliance and security risk.
The goal is to ensure that every job runs with the principle of least privilege, its actions are auditable, and its behavior is predictable. This is essential for meeting compliance standards like GDPR and SOC 2 and for protecting your company from internal and external threats. Plainly stated, you need to know who (or what) is running a job, what data it can touch, and have a clear record of its activities.
Incorporate these governance-focused metrics into your monitoring strategy:
- Job Owner and Permissions: Log which user or service principal owns and executes each job. Jobs should run with dedicated service principals, not individual user accounts, to ensure that access rights are not tied to a person’s employment status. Monitor for any jobs running with overly broad permissions.
- Data Access Patterns: Actively monitor and log which data assets (tables, files, views) a job reads from and writes to. This creates an invaluable audit trail. An alert should be triggered if a job suddenly attempts to access a sensitive table it has never touched before, as this could signal a misconfiguration or a security breach.
- Code and Library Versions: Your job’s behavior is defined by its code and its dependencies. Log the exact Git commit hash and library versions used in every job run. This helps prevent configuration drift and is crucial for security. If a vulnerability is discovered in a library (like Apache Log4j), you can immediately identify every job that is affected and needs to be patched.
- AI Model Behavior: For jobs that execute machine learning models for tasks like fraud detection or credit scoring, monitoring must extend to the model’s output. Track the distribution of predictions. A sudden shift in this distribution (model drift) could indicate that the model is no longer accurate and may require retraining or human review before its automated decisions can be trusted.
Building a Unified Monitoring Dashboard
Collecting metrics is only the first step. The true value comes from consolidating them into a unified view that serves different stakeholders across the organization. The goal is to move away from sifting through raw logs and toward a dashboard that provides at-a-glance insights into the health of your data platform, from both a technical and a business perspective.
When planning your dashboard, a key decision is whether to build a solution using open-source tools, use native cloud provider services, or invest in a commercial observability platform. Tools like Grafana combined with Prometheus are a popular open-source choice. Cloud services like Amazon CloudWatch or Azure Monitor offer deep integration with their respective ecosystems. The right choice depends on your team’s existing skills, budget, and specific requirements.
Crucially, you must tailor views to the audience. A single dashboard trying to serve everyone will ultimately serve no one. Consider creating role-specific views:
- Executive View (Leadership & Business Owners): This dashboard should focus entirely on business outcomes. Widgets might include “Data Freshness for Key Reports,” “SLA Compliance Percentage,” and “Monthly Data Platform Cost vs. Budget.” It should answer the question: “Is the data platform delivering the value we expect?”
- Operational View (Data Engineers & Ops): This is the technical command center. It should feature metrics like “Top 5 Failing Jobs in the Last 24 Hours,” “DBU Consumption by Team/Project,” “Jobs with Longest Duration,” and “Cluster Provisioning Errors.” It answers the question: “Is the platform stable and efficient?”
- Data Quality View (Data Analysts & Stewards): This view focuses on the data itself. It should visualize “Data Validation Pass/Fail Trends,” “Null Value Counts in Critical Tables,” and “Schema Drift Alerts.” It answers the question: “Can we trust our data?”
By routing information to the right people in the right context, your monitoring system becomes an active partner in managing your data platform, not just a passive recorder of events.
Your Next Steps: From Reactive to Proactive Monitoring
Implementing a comprehensive monitoring strategy can seem daunting. The key is to start small, deliver incremental value, and build momentum. Don’t try to monitor everything on day one. Instead, adopt an iterative approach focused on your most critical business processes. A proactive monitoring practice is built over time, not overnight.
Here is a simple action plan to get started:
- Identify One Critical Job: Select a single Databricks job that supports a high-value business process. This could be the job that powers your main revenue dashboard, a critical data science model, or a client-facing reporting pipeline.
- Define “Good” with Stakeholders: Sit down with the business users of that job’s output. Ask them: What does a successful run mean to you? What is the deadline for this data? What are the most important quality attributes? Document these business-level SLAs.
- Implement One Key Metric: Begin by tracking and visualizing just one metric beyond simple success or failure. Job duration versus its historical average is an excellent starting point because it often correlates with cost, performance, and data volume issues.
- Automate One Meaningful Alert: Based on the SLAs you defined, configure a single, high-signal alert. For example: “Send a notification to the #finance-data channel if the daily reporting job runs 50% longer than its weekly average.” This ensures the right people are notified of a potential problem, not just the engineering team.
- Review, Iterate, and Expand: After a week, review the results. Was the metric useful? Was the alert actionable, or was it noisy? Use these learnings to refine your approach, then select the next most critical job or the next most important metric (like data volume or a quality check) and repeat the process.
By following these steps, you can steadily transform your Databricks operations from a reactive, fire-fighting mode to a proactive, value-driven discipline that builds trust and accelerates your entire data strategy.
Your Next Read:
Category:
Get a FREE
Proof of Concept
& Consultation
No Cost, No Commitment!
