Your marketing team lives in HubSpot. It’s the command center for campaigns, contacts, deals, and customer interactions. But when it’s time to answer the big questions about performance and ROI, the workflow often breaks down. You export CSVs, wrestle with VLOOKUPs in Google Sheets, and spend hours manually stitching data together. This “spreadsheet glue” is not just tedious; it’s slow, brittle, and prone to human error. It prevents you from seeing the full picture of your customer journey.
There is a more robust, scalable, and automated way. By creating a direct pipeline between HubSpot and a cloud data warehouse like Google BigQuery, you can eliminate manual data wrangling entirely. This integration builds a solid foundation for sophisticated marketing attribution, allowing you to connect marketing activities directly to business outcomes, quickly and reliably.
The Business Case for Ditching Spreadsheet Glue
Moving from manual exports to an automated data pipeline isn’t just an IT upgrade. It’s a strategic business decision that delivers value across four key areas:
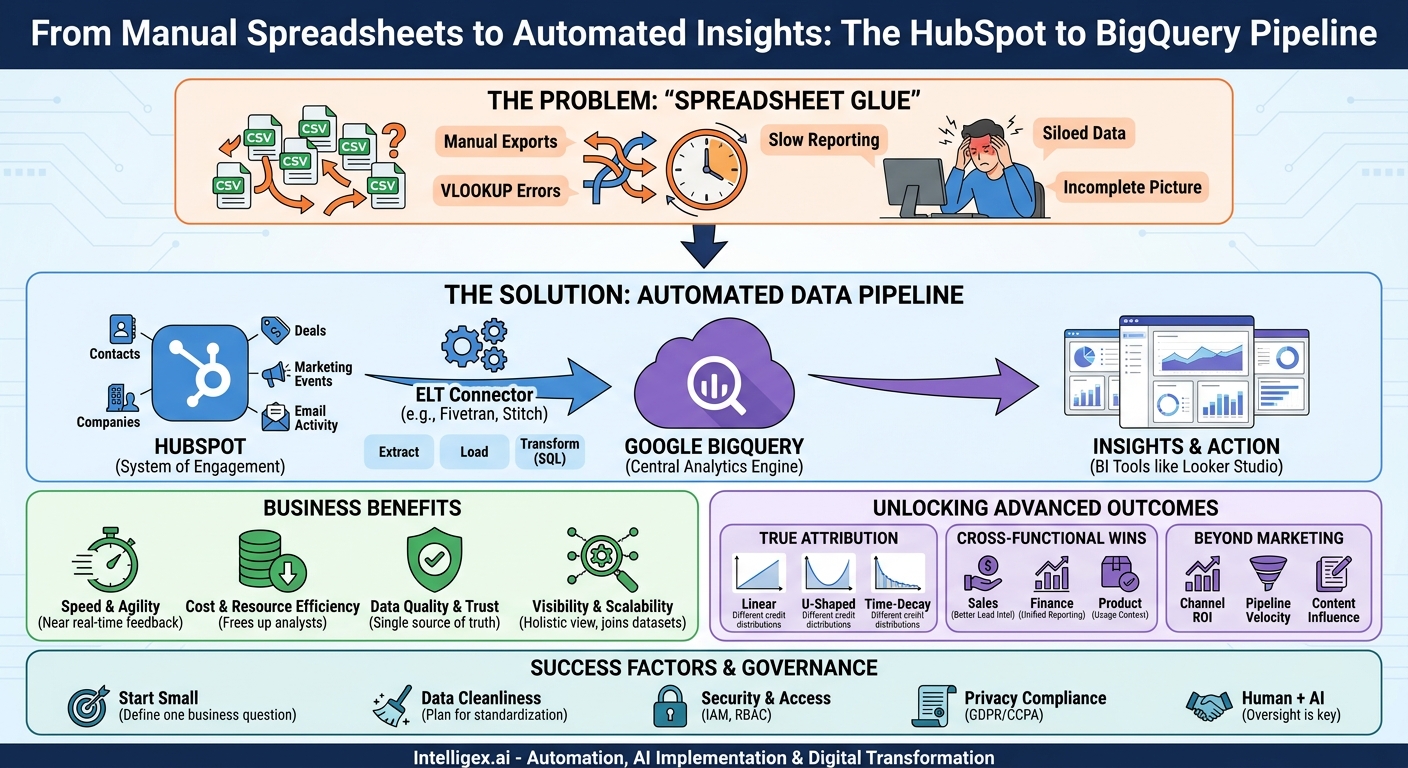
- Speed and Agility: Manual reporting on a weekly or monthly cadence means you’re always looking in the rearview mirror. An automated pipeline can refresh data hourly, giving your marketing team near real-time feedback on campaign performance. This allows them to double down on what’s working and cut losses on underperforming channels far more quickly, optimizing budget allocation on the fly.
- Cost and Resource Efficiency: Think about the cumulative hours your team spends downloading, cleaning, and merging spreadsheets each month. This is expensive, low-value work. Automating this process frees up your analysts and marketing operations specialists to focus on what they do best: interpreting data, deriving insights, and developing strategies that drive growth.
- Data Quality and Trust: Every manual step in a process is a potential point of failure. A copy-paste error, a broken formula, or an outdated file can lead to incorrect conclusions and poor decisions. A direct pipeline from HubSpot to BigQuery establishes a single source of truth that is consistent, reliable, and trustworthy, building confidence in your data across departments, from the marketing team to the finance office.
- Visibility and Scalability: Spreadsheets are finite. They struggle to join massive datasets or connect different parts of the business. A data warehouse like BigQuery is built for this. You can centralize HubSpot data alongside advertising data from Google Ads, product analytics from your application database, and financial records from your ERP system. This holistic view allows you to answer complex questions that are impossible with spreadsheets alone, such as, “What is the lifetime value of customers acquired through our annual conference?”
The Core Components of Your New Data Stack
This solution involves three main parts working in concert. Understanding each role is key to a successful implementation, even for non-technical stakeholders.
HubSpot: Your System of Engagement
This is your starting point. HubSpot stores a wealth of information about how your business interacts with prospects and customers. The key is to think of this data in terms of “objects.” The most common objects you’ll want to analyze include:
- Contacts: Individuals who have interacted with your company.
- Companies: The organizations those contacts belong to.
- Deals: The potential revenue opportunities in your sales pipeline.
- Marketing Events: Data from webinars, ad campaigns, and other marketing initiatives.
- Email Activity: Records of sends, opens, and clicks for your marketing emails.
The goal is to get this data out of HubSpot’s application-focused environment and into an environment built for analysis.
Google BigQuery: Your Central Analytics Engine
Google BigQuery is a cloud-native data warehouse. You can think of it as a massive, infinitely scalable database designed specifically for running very fast queries on very large datasets. Its “serverless” architecture means you don’t have to worry about managing servers or infrastructure; you simply load your data and start asking questions using standard SQL. It becomes the central repository where your HubSpot data can live and be joined with data from any other source.
The Connector: Your Automated Data Mover
The connector is the bridge that automatically moves data from HubSpot to BigQuery. You have a few options here, each with its own trade-offs:
- Native Integrations: Some platforms offer built-in sync features. HubSpot’s Operations Hub, for example, includes some data sync capabilities. These are often the easiest to set up but may be limited in flexibility or the specific data objects they support.
- Third-Party ELT Tools: This is the most common and often most effective approach. Tools like Fivetran, Stitch, or Airbyte specialize in this process. They provide pre-built connectors for hundreds of data sources, including HubSpot. You provide your credentials, select the data you want to sync, and the tool handles the rest, including managing API changes and ensuring data arrives correctly. ELT stands for Extract, Load, Transform; these tools extract the data from HubSpot, load it into BigQuery, and then you can transform it using SQL.
- Custom API Development: For highly specific or unique requirements, you can build your own integration using HubSpot’s APIs. This offers maximum flexibility but requires significant engineering resources to build and, more importantly, to maintain over time. For most marketing attribution use cases, this is unnecessary overhead.
A Step-by-Step Guide to Your First Data Pipeline
Setting up your first pipeline is more about planning than complex coding. By following a structured process, you can ensure the project delivers value from day one.
- Define Your Business Question: This is the most critical step. Don’t start by saying “we need to get all our HubSpot data into BigQuery.” Start with a specific, high-value question. For example: “What is the true customer acquisition cost (CAC) for leads generated by our paid search campaigns versus our organic blog content?” This focus will guide every subsequent decision.
- Identify the Necessary Data Objects: Based on your question, list the HubSpot objects you need. To calculate CAC by channel, you’ll need Deals (to see which ones closed and their value), Contacts (to see their original source), and Companies. You’ll also need ad spend data, which would be a separate data source to pipe into BigQuery.
- Set Up Your BigQuery Destination: In your Google Cloud account, create a new project (or use an existing one). Within that project, create a new BigQuery “dataset.” A dataset is simply a container that will hold all the tables of data coming from HubSpot. For example, you could name it HubSpot_Data.
- Choose and Configure Your Connector Tool: For most teams, a third-party ELT tool is the best choice. Sign up for a free trial. In their user interface, you’ll add a new “source” (HubSpot) and a new “destination” (BigQuery). The tool will walk you through authenticating both accounts, usually by providing an API key from HubSpot and granting the tool access to your BigQuery project.
- Select Your Objects and Start the Sync: Once authenticated, the connector will show you a list of all available HubSpot data objects. Select the ones you identified in step two. Start the initial sync. This first run may take anywhere from minutes to hours, depending on the volume of your data. After it’s complete, configure a sync schedule, such as every 6 or 12 hours.
- Validate the Data: Don’t assume everything worked perfectly. Run a few simple checks. In HubSpot, check the total number of contacts. Then, run a query in BigQuery to count the rows in your new `contacts` table. Do the numbers match? Spot-check a few specific deals in both systems to ensure all the properties (deal name, amount, stage) have been transferred correctly.
Unlocking True Marketing Attribution: What to Measure
Once your data is flowing reliably into BigQuery, you can move beyond the simplistic first-touch or last-touch attribution models that are often the default in marketing platforms. You now have the raw materials to build a much more nuanced and accurate view of what drives revenue.
With all the touchpoints in one place, you can model different attribution scenarios using SQL. For instance, you can implement:
- Linear Attribution: Every touchpoint in the customer journey gets an equal share of the credit for the deal. This is great for understanding the overall mix of marketing efforts.
- U-Shaped Attribution: This model gives 40% of the credit to the first touch and 40% to the lead conversion touch, with the remaining 20% distributed among the touches in between. It emphasizes the initial hook and the final push.
- Time-Decay Attribution: Touchpoints closer to the time of conversion get more credit. This model is useful for businesses with shorter sales cycles, as it values the interactions that pushed a prospect over the finish line.
Beyond models, you can build dashboards that track critical cross-functional metrics:
- Channel-Specific ROI: Combine marketing campaign data from HubSpot with ad spend data from platforms like Google Ads or LinkedIn Ads. You can now calculate a precise return on investment for each channel, not just based on leads, but on actual closed-won revenue.
- Pipeline Velocity by Source: How long does it take for a lead from a webinar to close compared to a lead from a trade show? By analyzing the timestamps on deal stage changes, you can identify which channels produce not just the most leads, but the fastest-moving pipeline.
- Content Influence on Major Deals: Join your HubSpot data with your web analytics. You can now see which blog posts, case studies, or whitepapers were viewed by contacts associated with your largest enterprise deals, even if that content wasn’t their first or last touch. This helps prove the value of top-of-funnel content.
Connecting the Dots Across the Business
The true power of a centralized data warehouse is realized when you start pulling in data from other departments. The HubSpot to BigQuery pipeline is often the first and most critical step in creating a 360-degree view of the business.
For Sales Leadership, this integration means better lead intelligence. You can build dashboards that score leads not just on demographic data, but on their actual engagement with marketing content. A sales rep can see that a prospect not only downloaded a whitepaper but also attended two webinars, signaling high intent.
For the Finance Team, it means an end to mismatched numbers. When finance pulls revenue data from the ERP and marketing pulls closed-deal data from HubSpot, the figures rarely align perfectly. By having both datasets in BigQuery, you can create a single, unified financial report that everyone trusts for forecasting and budget planning.
For Product and Engineering Teams, it provides invaluable context. By joining HubSpot data with product usage data from your application, you can answer powerful questions. Do customers acquired through technical blog posts adopt advanced features more readily? Does attending a customer-onboarding webinar reduce support tickets in the first 30 days? These insights can directly influence the product roadmap and improve customer retention.
Common Pitfalls and How to Avoid Them
While powerful, this process is not without its challenges. Being aware of common pitfalls can help you navigate the implementation smoothly.
The most common mistake is “boiling the ocean” by trying to sync all data without a clear purpose, leading to a confusing and underutilized data swamp. Another is underestimating data cleanliness. Your HubSpot instance may have duplicate contacts, inconsistent naming conventions, or missing data. Plan to dedicate time to cleaning and standardizing this data using SQL transformations within BigQuery after it’s loaded.
Use this short checklist to keep your project on track:
- [ ] Secure executive buy-in. Ensure leaders in both Marketing and IT/Data understand the business value and have approved the necessary resources (e.g., budget for an ELT tool).
- [ ] Start with a single, clear business question. Don’t try to solve everything at once. Pick one high-impact reporting gap and solve it first.
- [ ] Document your data definitions. What exactly constitutes an “Active Lead” or a “Marketing Qualified Lead (MQL)”? Write these definitions down so everyone is using the same language.
- [ ] Establish clear ownership. Designate one person or team responsible for the health of the data pipeline and another for the dashboards and analysis built on top of it.
- [ ] Plan for visualization. The project isn’t done when the data is in BigQuery. Plan how you will surface these insights to business users with tools like Google’s Looker Studio, Tableau, or Power BI.
A Note on Data Governance and Security
When you centralize customer data, you take on the responsibility of protecting it. Building a secure and well-governed foundation is not an afterthought; it’s a core requirement.
First, use the robust access control features within Google Cloud. With Identity and Access Management (IAM), you can enforce the principle of least privilege. A marketing analyst may need query access to aggregated data, but they likely do not need permission to view or export tables containing raw personally identifiable information (PII) like email addresses and phone numbers. Create different roles for different users.
Second, be mindful of data privacy regulations like GDPR and CCPA. The ability to easily locate and manage customer data in a central warehouse makes responding to data subject requests (like the right to be forgotten) a more manageable process. Work with your legal and compliance teams to ensure your data handling practices are sound.
Finally, remember that automation and AI are tools to support human expertise, not replace it. The goal of this pipeline is to provide clean, reliable data so that your team can make smarter, faster decisions. Always maintain human oversight to interpret the outputs, question the results, and apply business context that a machine never can.
Your Next Steps: From Insight to Action
Moving away from spreadsheet-based marketing analytics is a journey, but you can start today with a few simple, focused actions. Don’t wait for a perfect, all-encompassing data strategy. Instead, build momentum with a quick win.
- Identify your biggest reporting pain point. What is the one report that takes the most manual effort and is a constant source of frustration? This is your ideal candidate for a pilot project.
- Assemble a small, cross-functional team. Get one person from marketing operations who knows the HubSpot data inside and out, and one person from your IT or data team who is comfortable with cloud tools.
- Scope the pilot. Define the single business question you want to answer and the specific data required. Choose your connector tool and start a free trial; most offer enough credits to complete a proof-of-concept.
By taking these first steps, you begin building the data foundation that will not only solve today’s attribution challenges but will also scale with your business for years to come.
Your Next Read:
Category:
Get a FREE
Proof of Concept
& Consultation
No Cost, No Commitment!