

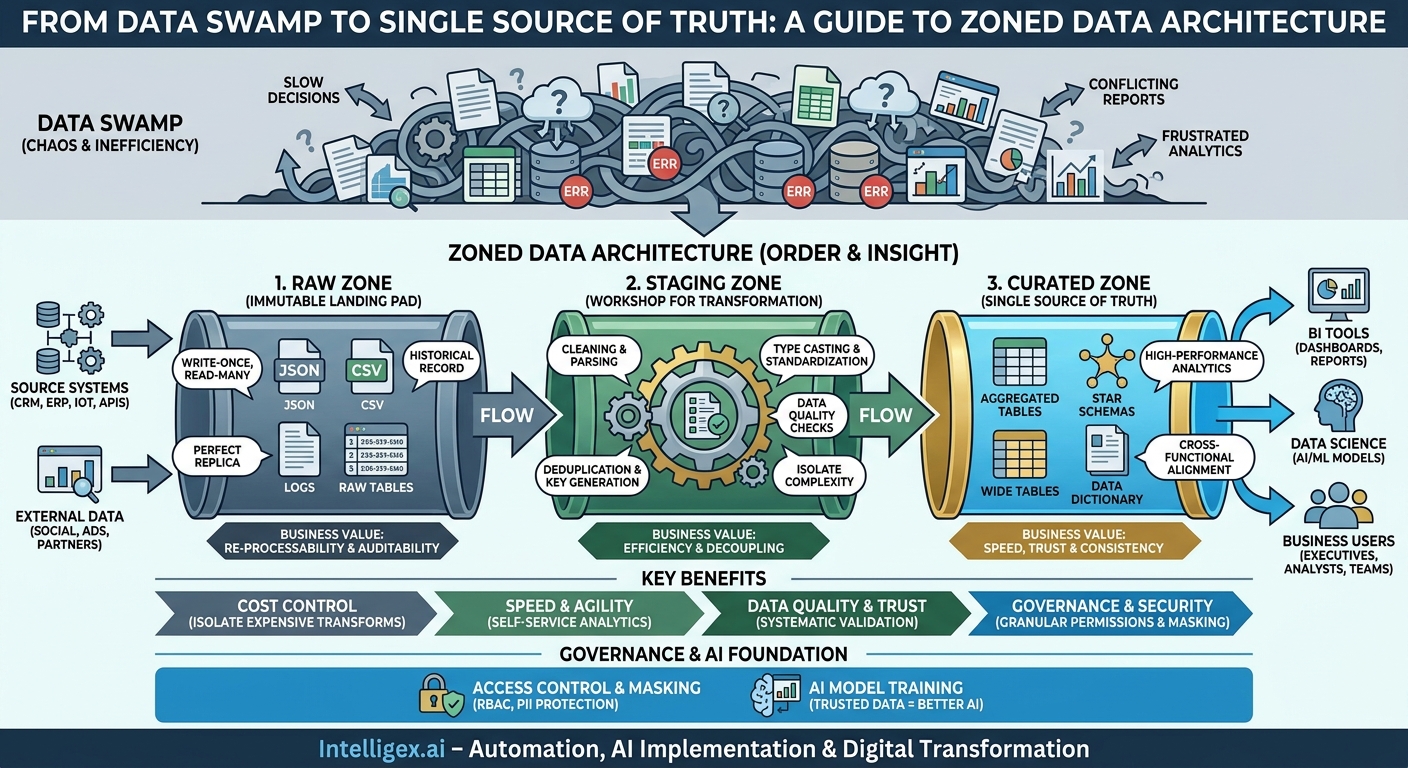
Your organization is sitting on a goldmine of data. But for many, it feels less like a structured mine and more like a chaotic pile of rocks. Data from sales, marketing, operations, and finance exists in dozens of formats and locations. When your teams try to answer critical business questions, they spend 80% of their time just trying to find and clean the right information. The result is slow decisions, conflicting reports, and a frustrated analytics team. This isn’t a people problem; it’s an architecture problem.
In a modern data platform like Snowflake, the solution is a zoned data architecture. By systematically organizing data into three distinct zones, Raw, Staging, and Curated, you transform a potential data swamp into a reliable, scalable, and high-performance analytics engine. This approach isn’t just a technical exercise. It’s a business strategy that directly impacts your ability to operate with speed, trust, and intelligence.
Why a Zoned Architecture is Non-Negotiable
Without a deliberate structure, a data lake quickly becomes a data swamp. Data is ingested without standards, documentation is an afterthought, and multiple teams create their own conflicting versions of the truth. Before long, nobody trusts the data, and the massive investment in a cloud data platform fails to deliver returns. A zoned architecture, often called a multi-layered or medallion architecture, imposes order on this chaos.
The core idea is to create a clear, one-way flow for data. It moves from its original, untouched state to a fully validated, business-ready format. Each zone has a specific purpose, a different set of users, and distinct performance and cost characteristics. This separation provides four immediate business advantages:
- Cost Control: You can isolate computationally expensive and complex data transformations to the Staging zone, using virtual warehouses that can be turned off when not in use. The Curated zone, accessed by many, can run on highly efficient warehouses optimized for fast reads, ensuring you only pay for the performance you need, where you need it.
- Speed and Agility: When a marketing analyst needs to understand campaign ROI, they know exactly where to go: the Curated zone. They don’t have to guess if they’re using the right sales data or if the currency has been converted correctly. This self-service capability slashes the time from question to insight.
- Data Quality and Trust: Data quality rules are not applied randomly. They are systematically enforced as data moves from one zone to the next. This ensures that by the time data reaches the Curated zone, it has been cleaned, validated, and integrated, creating a single source of truth that the entire organization can rely on.
- Governance and Security: You can’t apply a one-size-fits-all security policy to all data. The zoned approach allows you to set granular permissions. For instance, you can heavily restrict access to the Raw zone while providing broader access to aggregated, anonymized data in the Curated zone.
–
–
–
The Raw Zone: Your Data’s Immutable Landing Pad
Think of the Raw Zone as a perfect digital replica of your source systems. Its primary job is to ingest and store data exactly as it arrives, without any changes. This principle of immutability is the foundation of a trustworthy data platform.
Key Characteristics
The Raw Zone is a write-once, read-many environment. When data from a source like Salesforce or an internal database arrives, it is loaded as-is. If the source sends JSON, you store JSON. If it sends a CSV, you store the CSV content. You do not correct data types, filter records, or rename columns here. The only addition you should make is metadata, such as a load timestamp or the source filename. This creates an auditable, pristine historical record.
Business Value and a Practical Example
The biggest benefit of the Raw Zone is re-processability. Imagine your team discovers a mistake in the business logic used to calculate sales commissions, and this error has impacted reports for the last six months. Without a Raw Zone, you might have to request historical data dumps from multiple source systems, a time-consuming and sometimes impossible task. With an immutable Raw Zone, you have a perfect record of every piece of data that ever arrived. Your data engineers can simply fix the transformation logic in the Staging zone and re-process the historical data from the Raw Zone. What could have been a weeks-long fire drill becomes a controlled, overnight process.
Scenario (Supply Chain): A logistics company streams IoT data from sensors on its delivery trucks. This data, which includes GPS coordinates, speed, and engine temperature, arrives as a stream of thousands of small JSON messages per minute. These messages are loaded directly into a Snowflake table in the Raw Zone with a single `VARIANT` column and a `LOAD_TIMESTAMP` column. No one cleans it or structures it here. It’s a perfect, time-stamped archive, ready for processing or for forensic analysis if a delivery issue needs to be investigated later.
The Staging Zone: The Workshop for Transformation
If the Raw Zone is the library, the Staging Zone is the workshop. This is where the messy but critical work of cleaning, shaping, and integrating data happens. It’s an intermediate layer that is typically off-limits to business users, serving as the exclusive domain of data engineers and developers. The goal here is to prepare the data for its final presentation in the Curated Zone.
Isolating Complexity for Greater Efficiency
The Staging Zone’s main purpose is to decouple your source systems from your final business analytics. Source systems change. APIs get updated, fields are added, and formats are altered. By isolating all the transformation logic here, these changes only impact the Staging Zone. Your final, curated tables and the business reports built on them remain stable and unaffected.
This prevents a common problem: dozens of analysts all performing the same basic cleaning tasks independently. Instead of ten different people trying to convert a string to a date, that work is done once, correctly, in the Staging Zone. This consolidation of effort saves countless hours and eliminates inconsistencies.
A Step-by-Step Transformation Process
Let’s walk through a typical process for transforming raw customer data from a CRM like Salesforce into a clean, staged format.
- Load from Raw: A scheduled task or a dbt model selects data from the raw source table, for example, `RAW.CRM.ACCOUNT_JSON`. This table contains the raw JSON payloads from the CRM’s API.
- Parsing and Type Casting: The process parses the JSON structure into a flat, columnar table in the Staging Zone, `STG.CRM.ACCOUNT_CLEANED`. During this step, cryptic field names like `c_LastModDate` are renamed to `LastModifiedDate`, and text-based dates are cast into a proper `TIMESTAMP` data type. Numeric fields stored as strings are cast to `NUMBER`.
- Basic Cleansing: Simple rules are applied. For example, records marked with `is_deleted = true` are filtered out. A `CASE` statement might be used to standardize country codes, converting “USA,” “U.S.,” and “United States” all into a consistent “US.”
- Deduplication and Key Generation: The process identifies and removes duplicate records based on the account ID. It may also generate a unique surrogate key (a simple integer) to serve as a stable primary key for the table, which is more reliable for joins than a natural key that might change in the source system.
- Initial Data Quality Checks: Automated tests are run to validate the output. For example, a test could verify that the primary key column is unique and not null. Another test might check that a `AnnualRevenue` field does not contain negative values. Records that fail these checks can be quarantined in a separate table for review.
After this process, the data in `STG.CRM.ACCOUNT_CLEANED` is structured, standardized, and ready to be combined with other datasets.
The Curated Zone: The Single Source of Business Truth
The Curated Zone (also known as the Presentation, Gold, or Data Marts layer) is the final destination. This is the data that is exposed to the rest of the business. The information here is aggregated, well-modeled, fully documented, and optimized for high-performance analytics. When your executive team looks at a dashboard, this is the data they are seeing.
Built for Business Consumption
Data in the Curated Zone is not structured for engineers; it’s structured for business users. This often means creating denormalized “wide” tables or traditional star schemas (fact and dimension tables) that are intuitive to query and perform well in BI tools like Tableau or Power BI.
The naming conventions are critical. Columns should have clear, descriptive names like `TotalRevenue`, `ActiveCustomerCount`, or `AverageOrderValue`. A data dictionary should be maintained, explaining what each field means, how it’s calculated, and where it comes from. This documentation is what transforms a database table into a trusted analytical asset.
Achieving Cross-Functional Alignment
The greatest value of the Curated Zone is establishing a single source of truth. When the finance team calculates “quarterly recurring revenue,” they use the same curated table and logic as the sales operations team. This eliminates endless debates in meetings where different teams present different numbers for the same metric. Trust is built, and conversations can shift from questioning the data to making decisions based on it.
Scenario (HR & Finance): An HR department wants to analyze workforce costs. A curated table named `CURATED.FINANCE.EMPLOYEE_COST_MONTHLY` is created. It joins cleaned employee data from the HR system (like department and role) with cleansed payroll data from the finance system. It provides a single, trusted view with fields like `EmployeeID`, `FullName`, `Department`, `JobTitle`, `Month`, `TotalSalary`, and `TotalBonus`. Now, both HR and Finance can analyze headcount costs by department using the exact same underlying data, ensuring their reports are always aligned.
Putting It All Together: A Marketing Analytics Scenario
Let’s trace the journey of marketing data from source to insight to see how the zones work together in practice.
The Goal: The CMO wants a single dashboard to track marketing campaign performance and its influence on sales pipeline, combining data from Google Ads, Facebook Ads, and the company’s CRM.
- Raw Zone: Daily data files from Google Ads (CSVs) and API payloads from Facebook Ads (JSON) are loaded into separate tables in the `RAW.MARKETING` schema. The raw data is untouched, preserving columns with names like `ad_spend_gcp` and `fb_clicks_total`. A separate pipeline ingests raw opportunity data from the CRM.
- Staging Zone: In the `STG.MARKETING` schema, several transformation jobs run. One job cleans the Google Ads data, standardizing column names to `CampaignName`, `Spend`, `Impressions`, and `Clicks`. Another does the same for the Facebook data. A third job cleans the CRM opportunity data. The key step here is standardizing the campaign naming convention across all platforms so they can be joined together.
- Curated Zone: Finally, a single, wide table is created: `CURATED.MARKETING.CAMPAIGN_PERFORMANCE_AGG`. This table joins the cleaned data from all three sources. It contains clear, business-friendly columns like `CampaignName`, `MarketingChannel`, `TotalSpend`, `TotalImpressions`, `LeadsGenerated`, and `InfluencedPipelineValue`. It is aggregated by campaign and by day.
–
The Result: The marketing analytics team can now connect their BI tool to this one table. They can easily build a dashboard that shows total spend across all channels and its direct impact on sales, without ever having to worry about the complexity of the raw source data. When a new marketing channel like LinkedIn Ads is added, engineers only need to add new raw and staging pipelines; the final curated table’s structure can remain stable for the business users.
What to Measure
To gauge the success of this architecture, track these key metrics:
- Time-to-Insight: The average time it takes for an analyst to answer a new, ad-hoc business question. This should decrease significantly.
- Data Quality Incidents: The number of times a report or dashboard has to be corrected due to underlying data errors. This should trend toward zero.
- Query Runtimes: The performance of queries against Curated Zone tables. These should be consistently fast.
- Analyst Time Allocation: The percentage of time your analytics team spends on data preparation versus actual analysis. This should shift heavily toward analysis.
Governance and AI: Using Your Zones Safely
A zoned architecture is not just for efficiency; it is a powerful framework for data governance and security, which is essential before you can safely leverage your data for advanced analytics or AI.
Access Control by Design
The zones provide natural security boundaries. Using Snowflake’s Role-Based Access Control (RBAC), you can implement a robust security model:
- Raw Zone: Access is extremely limited. Only data ingestion service accounts should have write permissions. A small group of data engineers might have read-only access for debugging. No one else.
- Staging Zone: Access is restricted to data engineers and developers who are actively building and maintaining the transformation pipelines.
- Curated Zone: This is where you apply business-level permissions. The `FINANCE_ANALYST` role can see all tables in the `CURATED.FINANCE` schema, but not the `CURATED.HR` schema. Within a schema, you can use features like Secure Views to restrict access to specific rows or columns.
Protecting Sensitive Data
For sensitive data like Personally Identifiable Information (PII), you can apply masking policies in the Curated Zone. For example, a dynamic data masking policy can be applied to the `EmployeeEmail` column. For most users, the policy returns a masked value like `*********@company.com`. However, for users with a privileged role like `HR_MANAGER`, the policy returns the actual, unmasked email address. This allows you to secure data at the source without creating multiple copies of it.
Building a Foundation for AI
AI and machine learning models are only as good as the data they are trained on. The famous “garbage in, garbage out” problem is the single biggest reason AI projects fail. Your Curated Zone is the ideal source for training data. Because it is already cleaned, structured, integrated, and trusted, your data science team can spend less time on data wrangling and more time on feature engineering and model development. Furthermore, by using governed, curated data, you reduce the risk of introducing bias or privacy violations into your AI models.
Common Pitfalls and How to Avoid Them
Implementing a zoned architecture is a journey, and there are common traps to avoid.
- The “Curated Swamp”: This happens when business logic finds its way back into BI tools. If every analyst calculates “Net Revenue” slightly differently in their own reports, you’ve lost your single source of truth. Avoidance: Institute a clear policy. If a business metric is needed in more than one place, it must be defined and calculated within the Curated Zone for everyone to use.
- Analysis Paralysis: Teams can spend months trying to design the “perfect” enterprise-wide model for the Staging Zone before delivering any value to the business. Avoidance: Be agile. Start with a single business domain. Deliver a valuable curated dataset for the sales team first. Use that success to build momentum and apply the learnings to the next domain.
- A Mutable Raw Zone: The most dangerous pitfall is allowing changes or “corrections” to data in the Raw Zone. This breaks auditability and destroys your ability to reliably reprocess data. Avoidance: Use technical controls. Set permissions on your Raw Zone schemas in Snowflake to be strictly read-only for everyone except the ingestion service account.
Your Next Steps to a Zoned Architecture
Getting started doesn’t require a multi-year roadmap. You can begin delivering value in weeks by following a pragmatic, iterative approach.
- Identify a High-Value Use Case: Don’t try to organize all your data at once. Partner with a business unit and pick one pressing problem. Is it creating a unified 360-degree view of your customers? Or maybe it’s streamlining financial reporting for month-end close?
- Map the Data Flow: For that single use case, whiteboard the data’s journey. What are the source systems? What transformations are needed in the workshop (Staging)? What does the final, polished product for the business user (Curated) look like? This simple exercise becomes the blueprint for your first implementation.
- Build, Deliver, and Iterate: Build the pipelines for this first use case. Deploy the curated data tables and show your business partners how easy it is to use them. The enthusiasm from this first success will provide the business case and momentum to tackle the next use case.
- Codify Your Standards: As you build, document your decisions. Create a simple guide for naming conventions, define your data quality testing strategy, and document your security roles. These standards will ensure that as your data platform grows, it remains a well-organized asset, not a chaotic swamp.
By adopting a Raw, Staging, and Curated architecture, you are building more than just a data pipeline. You are building a foundation of trust, speed, and governance that will empower your entire organization to make better, faster decisions with data.
Your Next Read:
Category:
Get a FREE
Proof of Concept
& Consultation
No Cost, No Commitment!
