

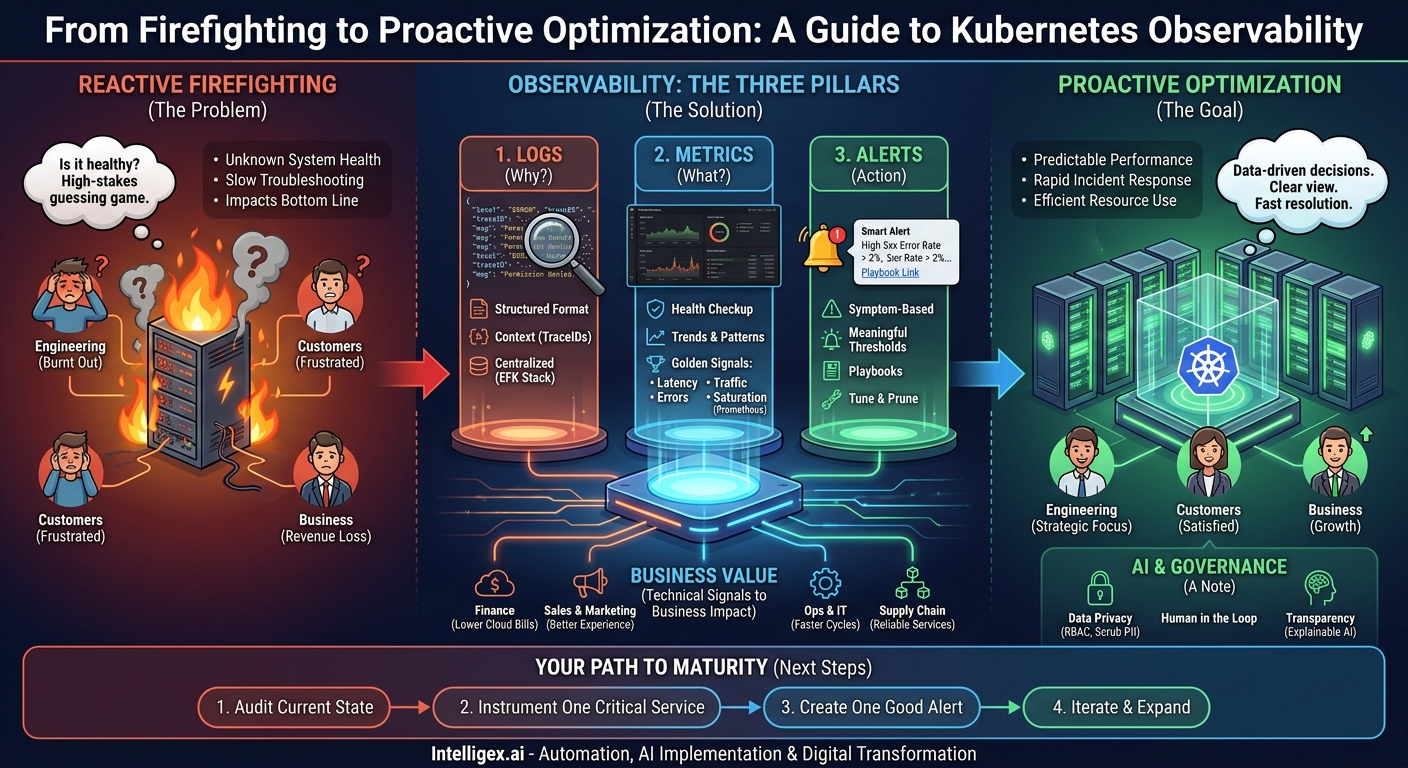
Your Kubernetes environment is running. Applications are deployed, services are communicating, and customers are interacting with your products. But is it healthy? When a customer’s payment fails or an internal report times out, the clock starts ticking. Without a clear view into your systems, troubleshooting becomes a high-stakes guessing game that burns engineering hours, frustrates customers, and directly impacts your bottom line.
In a dynamic environment like Kubernetes, where containers are created and destroyed in seconds, traditional monitoring falls short. You need more than just a green light on a server status page. You need observability: the ability to ask arbitrary questions about your system without having to know in advance what you’ll need to ask. This capability is built on three practical pillars: logs, metrics, and alerts. Mastering them transforms your Kubernetes workflows from reactive firefighting to proactive, data-driven optimization.
From Business Problem to Technical Signal
Before diving into the technical details, it’s crucial to connect observability to business value. A technical problem is always a business problem in disguise. When you can’t see what’s happening inside your Kubernetes clusters, every department feels the impact.
- For Finance: Unseen inefficiencies, like over-provisioned pods or idle services, translate directly to a higher cloud bill. The inability to quickly resolve outages means measurable revenue loss.
- For Sales and Marketing: A slow or buggy application experience during a major campaign can nullify marketing spend and damage brand reputation, leading to lower conversion rates and customer churn.
- For Operations and IT: Without clear signals, teams spend their days chasing ghosts. This leads to burnout, slower release cycles, and an inability to focus on strategic projects that drive growth.
- For Supply Chain: If an inventory management service fails silently, it can cause cascading effects, from incorrect stock levels on your e-commerce site to flawed demand forecasting.
Effective observability flips this script. It provides a shared, factual basis for communication between technical and business teams. Instead of saying “the website is slow,” you can say, “p99 latency for the checkout service has increased by 300ms, impacting 15% of users.” This precision accelerates resolution, clarifies business impact, and enables smarter decision-making.
The First Pillar: Making Sense of Logs
Logs are the most granular form of data you can collect. They are timestamped, event-driven records of what happened inside a specific application or system component. In Kubernetes, this is typically anything your application writes to standard output (stdout) and standard error (stderr). While metrics tell you that something is wrong, logs are often your best tool for figuring out why.
Imagine a user reports being unable to upload a profile picture. Your metrics might show a spike in errors for the `user-profile-service`, but that’s not enough. By inspecting the logs for the specific pod that handled that user’s request, you might find an explicit error message: “Permission denied: cannot write to storage bucket /user-images.” The problem is immediately clear.
What Makes a Good Log?
Not all logs are created equal. To be useful for debugging in a complex system, logs must be more than simple text strings. They should be structured and contain rich context.
- Structured Format: Plain text logs are difficult to parse and query. Adopt a structured format like JSON. Instead of `User 123 failed login`, write `{“timestamp”: “…”, “level”: “WARN”, “userID”: “123”, “event”: “login_failure”, “reason”: “invalid_credentials”}`. This makes logs machine-readable and easy to filter.
- Context is Key: A log message should include relevant identifiers. In a microservices architecture, this means including a `traceID` or `correlationID` that links a single user request across multiple services. This allows you to reconstruct the entire journey of a request that failed.
- Appropriate Log Levels: Use standard log levels (e.g., DEBUG, INFO, WARN, ERROR, FATAL) consistently. This allows you to filter out noise during an investigation. You don’t need to see thousands of DEBUG messages when you’re hunting for a critical ERROR.
- Avoid Sensitive Data: Never log personally identifiable information (PII), passwords, or secret keys in plain text. This is a major security and compliance risk.
Implementing a centralized logging solution (like the EFK stack: Elasticsearch, Fluentd, and Kibana) is essential. It aggregates logs from all your containers into a single, searchable interface, which is a non-negotiable requirement in a distributed system like Kubernetes.
The Second Pillar: Measuring What Matters with Metrics
If logs are the diary of your application, metrics are its regular health checkup. Metrics are numeric, time-series data that represent the state of your system over time. They are aggregated, lightweight, and ideal for understanding trends, patterns, and overall system performance. You don’t look at metrics to understand one user’s failed request; you look at them to understand that 5% of all requests have been failing for the past hour.
Metrics are the foundation of dashboards and, as we’ll see next, effective alerting. They provide the high-level view you need to spot trouble before it becomes a full-blown outage.
A Step-by-Step Process to Identify Key Metrics
You can measure thousands of things, but most of them are noise. Focus on metrics that directly reflect the health of your service and the experience of your users. The “Golden Signals” framework is a great starting point.
- Measure Latency: How long does it take to service a request? You should distinguish between the latency of successful requests and the latency of failed requests. A key metric here is tracking latency percentiles (like p95 or p99) to understand the experience of your worst-off users, not just the average.
- Measure Traffic: How much demand is being placed on your system? This could be measured in requests per second for a web service or transactions per minute for a financial processing system. A sudden drop in traffic can be just as alarming as a sudden spike.
- Measure Errors: What is the rate of requests that fail? This should be tracked as a percentage of total traffic. Monitoring for an increase in HTTP 500 errors (server errors) or 400 errors (client errors) can point to different kinds of problems.
- Measure Saturation: How “full” is your service? This is a measure of your system’s capacity. For a CPU-bound service, this would be CPU utilization. For a database, it could be disk I/O or the number of available connections. High saturation is a leading indicator of future latency and error problems.
Tools like Prometheus have become the standard for metrics collection and storage in the Kubernetes world. By instrumenting your applications to expose these key metrics, you gain the ability to build powerful dashboards that give you an at-a-glance view of system health, connecting technical performance to business impact.
The Third Pillar: From Noise to Action with Alerting
Logs and metrics give you visibility. Alerts turn that visibility into action. An alert is an automated notification that fires when a predefined condition is met, signaling that a human needs to pay attention. However, a poorly designed alerting strategy can be worse than none at all. “Alert fatigue,” caused by too many false positives or unactionable notifications, quickly teaches teams to ignore them altogether.
Designing Alerts That Matter
A good alert is urgent, actionable, and rare. It should represent a real or imminent problem that impacts users or the business.
- Alert on Symptoms, Not Causes: Don’t alert when CPU usage is at 80%. Alert when p99 latency for user logins is over 500ms. High CPU is a potential cause, but high latency is the actual user-facing symptom. Focusing on symptoms ensures you are only woken up for things that are truly broken.
- Use Meaningful Thresholds: A static threshold (e.g., “alert if more than 10 errors per minute”) can be noisy. A better approach might use a percentage (“alert if the error rate exceeds 2% of total traffic for 5 minutes”) or look for sudden deviations from a historical baseline.
- Include a Playbook: Every alert notification should include a link to a wiki or document (a “playbook”) that tells the on-call engineer what the alert means, its likely causes, and the first steps to take for diagnosis. This dramatically reduces the time to resolution, especially for new team members.
- Tune and Prune Aggressively: If an alert fires and no action is taken, it’s a bad alert. Regularly review your alerts. Are they too sensitive? Not sensitive enough? Do they still represent a real business problem? Be ruthless about deleting alerts that are no longer valuable.
Effective alerting is the critical link between observing a problem and starting the process to fix it. It’s the system’s automated tap on the shoulder that prevents a small issue from becoming a catastrophic failure.
Connecting the Dots: A Practical Workflow Example
Let’s see how these three pillars work together during a real-world incident. Imagine a B2B SaaS company that provides a critical API for its customers.
1. The Alert: At 2:05 AM, an alert fires in the on-call engineer’s notification channel: “High 5xx Error Rate on Customer API (p99 latency > 800ms for 5m). Playbook: [link].” The alert is based on a key symptom (high error rate and latency), not a low-level cause.
2. Investigation with Metrics: The engineer opens the linked dashboard. They immediately see the metrics for the `api-gateway` service. The error rate and latency graphs show a sharp spike starting around 2:00 AM. Traffic volume looks normal. They check the metrics for upstream services and notice that one particular service, `customer-data-processor`, is also showing very high CPU saturation.
3. Diagnosis with Logs: The problem seems to be with the `customer-data-processor` service. The engineer filters the centralized logs to show only ERROR-level messages from pods in that service from the last 15 minutes. The logs are filled with a recurring message: `{“level”: “ERROR”, “traceID”: “…”, “msg”: “Failed to execute complex query”, “error”: “Query timeout expired”}`.
4. Resolution and Follow-up: The log message points directly to a slow database query. A recent code change added a new, unoptimized query that is timing out under normal load. The engineer initiates a rollback of the last deployment. Within minutes, the metrics on the dashboard return to normal, and a new “All Clear” notification is sent. The `traceID` from the logs is used to identify which customers were most affected so the support team can perform targeted outreach in the morning.
This entire process, from detection to resolution, took minutes instead of hours. The combination of actionable alerts, high-level metrics, and detailed logs provided a clear path from symptom to cause, minimizing business impact.
Observability and AI: A Note on Governance
As observability platforms become more sophisticated, many are incorporating AI and machine learning to detect anomalies, predict failures, and even suggest root causes. This data-rich environment is a perfect application for AI. However, this power comes with responsibility.
The logs and metrics you collect are a detailed record of your business operations and user interactions. This data must be handled with care.
- Data Privacy and Security: Be vigilant about scrubbing sensitive data like PII, financial details, or credentials before they are ingested by your observability platform. Use role-based access control (RBAC) to ensure that engineers can only see the data relevant to their services.
- Human in the Loop: While AI-driven alerting can be powerful for spotting unusual patterns, it should not be the sole authority. Always maintain a clear process for human review and validation, especially before any automated remediation action (like restarting a service) is taken. An AI model doesn’t understand your business context or a planned maintenance window.
- Transparency: When using AI for analysis, ensure the system can explain why it flagged something as an anomaly. A “black box” that just says “something is wrong” is not much more helpful than a vague alert. The goal is to augment human intelligence, not replace it.
By treating your observability data with the same security and governance standards as your production application data, you can safely leverage advanced analytical tools without introducing unnecessary risk. Using standards like OpenTelemetry for data collection can help enforce these governance policies consistently across your organization.
Your Path to Kubernetes Observability: Next Steps
Achieving mature observability is a journey, not a destination. You don’t need a perfect, all-encompassing system from day one. Start small and build incrementally by focusing on the most critical workflows in your business.
- Audit Your Current State: What do you have today? Are you collecting logs? Are they structured? Do you have a metrics platform? Identify your most critical application and ask yourself: if this breaks at 3 AM, how would I know, and what information would I have to fix it?
- Instrument One Critical Service: Choose one important service and instrument it properly. Implement structured logging. Expose the four “Golden Signals” as Prometheus metrics. Build a single dashboard that shows you the health of that service at a glance.
- Create One Good Alert: Based on the metrics from that service, create one high-value, symptom-based alert. Make sure it links to a simple playbook, even if it’s just a one-page document. Run a test to ensure the alert fires as expected.
- Iterate and Expand: Once you’ve proven the value on a single service, use it as a template to expand your observability practices to the rest of your environment. Socialize the dashboards and processes with other teams to create a shared understanding of system health.
By taking these concrete steps, you can move from a reactive state of uncertainty to a proactive position of control. True Kubernetes observability isn’t about collecting endless data; it’s about collecting the right data and using it to build faster, more reliable, and more efficient systems that directly contribute to your business’s success.
Your Next Read:
Category:
Get a FREE
Proof of Concept
& Consultation
No Cost, No Commitment!
