

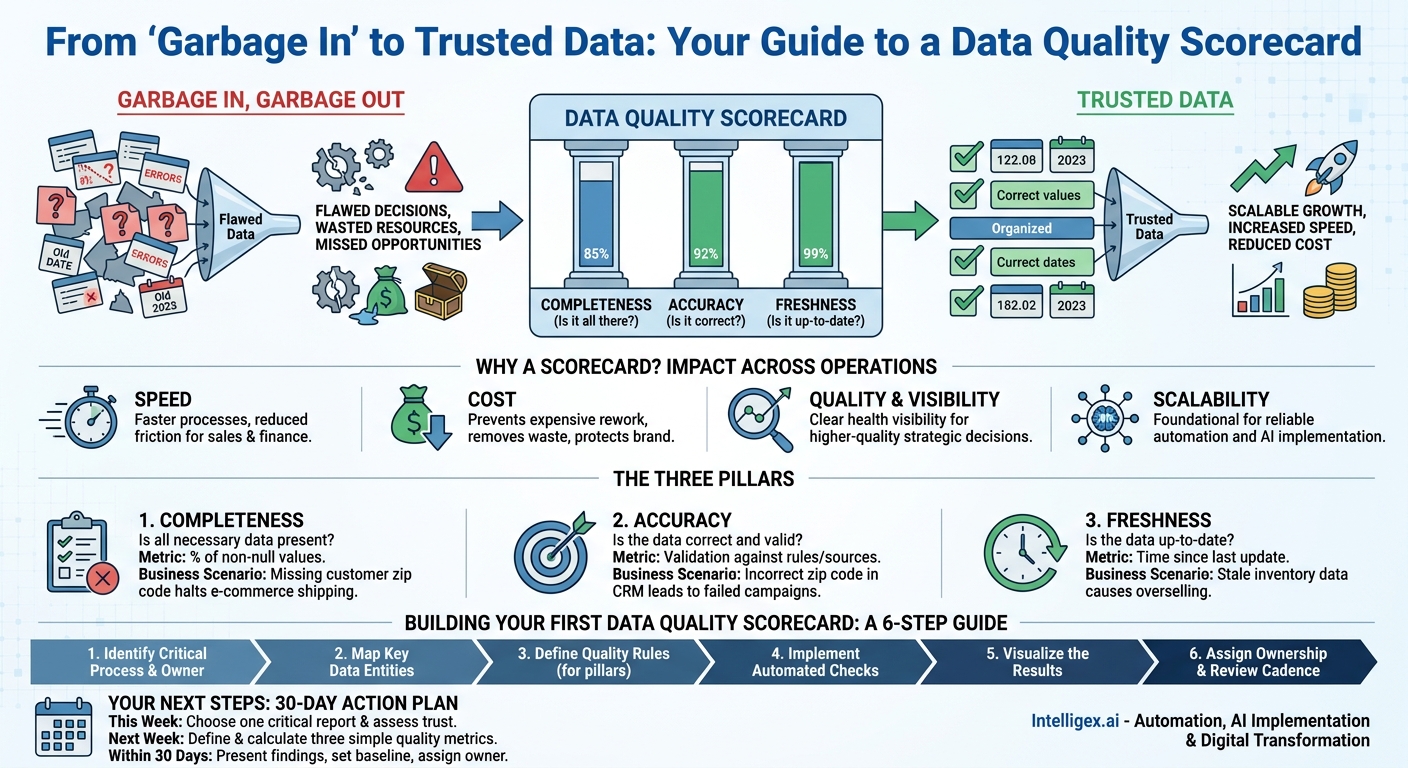
Every business leader intuitively understands the phrase “garbage in, garbage out.” We know that flawed data leads to flawed decisions, wasted resources, and missed opportunities. Yet, many organizations treat data quality as an abstract problem, a technical issue for the IT department to solve someday. This passive approach is no longer viable. In a world driven by digital operations and AI, a reactive stance on data quality is a direct threat to your bottom line, your customer experience, and your competitive edge.
The solution is to make data quality tangible, measurable, and visible. A Data Quality Scorecard transforms abstract concerns into a concrete management tool. It’s not just a report; it’s a system for continuous improvement that directly impacts business speed, cost, quality, and visibility. By focusing on three core pillars, Completeness, Accuracy, and Freshness, you can build a framework that empowers teams to trust and use their data effectively, driving scalable growth instead of scalable chaos.
Why a Scorecard? Moving Beyond “Garbage In, Garbage Out”
A Data Quality Scorecard is a centralized dashboard that tracks, measures, and reports on the health of your most critical data assets. It translates technical data metrics into clear business-focused scores. Instead of wondering if your CRM data is “good,” you can know that your “Lead Contact Information” has a completeness score of 85%, an accuracy score of 92%, and a freshness score of 99%. This shift from guessing to knowing has profound business implications.
Consider the impact across your operations:
- Speed: When your sales team trusts the contact data in your CRM, they spend less time verifying phone numbers and more time selling. When your finance team has accurate vendor information, invoices are processed faster, enabling you to capture early payment discounts. Good data removes friction and accelerates core business processes.
- Cost: Poor data quality creates expensive rework. A marketing campaign sent to inaccurate addresses wastes money on printing and postage, and it damages brand perception. A supply chain that relies on stale inventory data leads to unnecessary holding costs or expensive expedited shipping to prevent stockouts. A scorecard helps you identify and fix these issues at the source, preventing costly downstream errors.
- Quality and Visibility: You cannot manage what you do not measure. A scorecard provides clear visibility into the health of your data ecosystem. This allows leaders to make higher-quality strategic decisions. It helps a marketing leader understand campaign ROI with confidence and enables an operations manager to reliably forecast demand. It provides a shared language for IT and business teams to collaborate on improvements.
- Scalability: As you invest in automation, AI, and digital transformation, the quality of your underlying data becomes the primary bottleneck. An AI-powered recommendation engine is useless if its product data is incomplete. An automated payroll system is a liability if employee data is inaccurate. A scorecard is a foundational tool for ensuring your technology investments can scale reliably and deliver their promised value.
The Three Pillars of Your Data Quality Scorecard
While there are many dimensions to data quality, starting with a focus on three fundamental pillars provides the greatest initial impact. They are easy to understand, directly tied to business outcomes, and form a solid foundation for a more mature data governance program. Let’s break down each one.
1. Completeness: Is all the necessary data present?
Completeness measures whether required data fields are populated. It’s the most straightforward metric to start with. A record is incomplete if a critical piece of information is missing.
- Business Scenario: An e-commerce order record is missing the customer’s zip code. The fulfillment process halts, requiring manual intervention to find the information, delaying the shipment and increasing operational costs.
2. Accuracy: Is the data correct and valid?
Accuracy assesses if the data in a field is factually correct. An email address might be present (100% complete), but if it contains a typo or is fake, it is not accurate. This dimension often requires validation against an external source or a set of predefined rules.
- Business Scenario: A customer record in a CRM like Salesforce lists a customer’s state as “CA” but their zip code as “10001” (a New York City zip code). The data is internally inconsistent and therefore inaccurate, which could lead to failed marketing campaigns and incorrect sales territory assignments.
3. Freshness (or Timeliness): Is the data up-to-date?
Freshness measures how recently the data was recorded or updated. Data that was accurate last year may be dangerously out of date today. This is especially critical for operational data that changes frequently.
- Business Scenario: A warehouse management system shows 50 units of a product in stock, but the data hasn’t been updated since yesterday. If 40 units were sold this morning, a salesperson relying on that stale data might promise a large order that the company cannot fulfill, damaging a customer relationship.
Pillar 1: Measuring Data Completeness
Incomplete data is a silent killer of efficiency. It forces employees into detective work, derails automated processes, and skews analytics. Measuring completeness is your first line of defense.
What to Measure
The primary metric for completeness is the percentage of non-null values for a given field across a dataset. For a critical “customer email” field, the metric is:
(Number of Records with an Email Address / Total Number of Customer Records) * 100%
You can apply this to any field, but the key is to prioritize. Not all fields are created equal. An incomplete “Notes” field is an inconvenience; an incomplete “Shipping Address” field stops a core process cold.
A Quick Checklist for a Completeness Audit
To start, pick one critical business process, such as “new customer onboarding” or “order fulfillment,” and evaluate the data that supports it.
- Identify Critical Fields: Which 5-10 data fields are absolutely essential for this process to run smoothly?
- Establish a Threshold: What is the minimum acceptable completeness percentage for each field? (e.g., Email must be 98% complete).
- Run the Numbers: Execute a simple query or use a data profiling tool to calculate the current completeness score for each critical field.
- Investigate Gaps: For fields below your threshold, ask why. Is it a problem with a web form? A faulty API integration? A lack of training for data entry staff?
– Example (Onboarding): Customer Name, Email, Phone Number, Billing Address, Service Tier.
By focusing on the most critical fields first, you ensure your efforts are directly tied to improving a tangible business outcome.
Pillar 2: Gauging Data Accuracy
Accurate data builds trust. When your teams trust the data, they can make decisions with confidence and speed. Inaccurate data erodes that trust, forcing people to rely on manual checks, spreadsheets, and gut feelings, which is not a scalable strategy.
What to Measure
Measuring accuracy is more complex than measuring completeness because it requires a “source of truth” or a set of validation rules. There are several common approaches:
- Format Validation: Does the data conform to an expected pattern? For example, using regular expressions (regex) to check that a phone number contains the correct number of digits or that an email address includes an “@” symbol. The metric is the percentage of values that pass the format check.
- Reference Data Validation: Does the data match an approved list of values? For example, checking if a “State” field contains a valid two-letter US state code from an authoritative list. The metric is the percentage of values that match the reference list.
- Cross-System Validation: Does the data in one system match the data in another source-of-truth system? For example, does the customer address in your billing system match the one in your CRM? The metric is the percentage of records that are consistent across systems.
Common Pitfalls to Avoid
When measuring accuracy, it’s easy to fall into a few traps. Be mindful of setting rules that are too strict, which can incorrectly flag valid data (e.g., a rule that rejects international phone number formats). Similarly, avoid the “perfect is the enemy of the good” mindset. Aim for continuous improvement, not immediate 100% accuracy, which is often unattainable and cost-prohibitive.
Pillar 3: Tracking Data Freshness
In today’s fast-paced environment, old data is often wrong data. The value of information decays over time, and a Data Quality Scorecard must account for this by measuring freshness, also known as timeliness.
What to Measure
Freshness is typically measured as the time lag, or latency, between an event happening in the real world and the data about that event being available for use in your systems.
- Update Latency: For records that are updated, measure the time since the last modification. A metric could be `(Current Time – Last_Updated_Timestamp)`. Your scorecard could track the average latency or the percentage of records updated within an acceptable window (e.g., “99% of inventory records updated within the last 5 minutes”).
- Data Ingestion Lag: For data arriving from external sources, measure the delay between its creation and its availability in your data warehouse or lakehouse. This is crucial for systems that use cloud infrastructure like Amazon Web Services to process streaming data.
Business Impact of Stale Data
The required level of freshness depends entirely on the business use case.
- Finance: End-of-day financial reporting may only require data to be fresh within a 24-hour window.
- Marketing: A customer segmentation model might be effective if refreshed weekly.
- Operations: An e-commerce inventory system needs data that is fresh to the second to prevent overselling.
Your scorecard should reflect these different business requirements. Assigning a single freshness target to all data is inefficient and ignores the specific needs of each department.
Building Your First Data Quality Scorecard: A Step-by-Step Guide
Creating a comprehensive, enterprise-wide scorecard is a significant project. However, you can start small and deliver value quickly by following a pilot-based approach. Here is a practical, six-step process to get your first scorecard up and running.
- Identify a Critical Business Process and Data Owner: Do not start with “all our data.” Start with one high-impact area. This could be the “lead-to-cash” process for Sales, the “procure-to-pay” process for Finance, or the “hire-to-retire” process for HR. Crucially, identify a business leader who owns this process and feels the pain of poor data quality. Their buy-in is essential.
- Map the Key Data Entities: For your chosen process, identify the 3-5 most important data objects. For “lead-to-cash,” this might be Account, Contact, Opportunity, and Product records.
- Define Quality Rules for the Three Pillars: Work with the data owner and subject matter experts to define what “good” looks like. For each data entity, define a handful of critical rules for completeness, accuracy, and freshness. Be specific.
- Completeness Example: “For an Opportunity record to be considered complete, the ‘Close Date’ and ‘Amount’ fields must be populated.”
- Accuracy Example: “For a Contact record, the ‘Email’ field must be a valid email format.”
- Freshness Example: “An Opportunity’s ‘Last Modified Date’ must be within the last 30 days for it to be considered active.”
- Implement Automated Checks: This is where technology comes in. Use data quality tools (open-source options like Great Expectations or commercial platforms) or simple SQL scripts to run your rules against the data automatically. The key is automation; manual spot-checking is not sustainable.
- Visualize the Results: The output of your checks should feed a simple dashboard. This is your scorecard. It doesn’t need to be complex. A simple bar chart showing the score for each rule (e.g., “Contact Email Accuracy: 91%”) is far more effective than a raw table of error logs. The goal is at-a-glance understanding for business stakeholders.
- Assign Ownership and Set a Review Cadence: A scorecard is not a “set it and forget it” tool. For each metric, there should be a clear owner responsible for investigating and remediating issues. Schedule a regular meeting (e.g., bi-weekly) with the data owner and relevant team members to review the scorecard, discuss trends, and prioritize fixes.
Data Governance and AI: A Note on Safe Implementation
As you begin to systematically measure and report on data quality, it’s vital to handle the process with care, especially as you prepare data for use in AI and machine learning models. A scorecard is a powerful governance tool, but it must be implemented safely and ethically.
First, consider privacy and access control. A scorecard should report on the quality of data without exposing the sensitive data itself. For example, a report can show that “5% of employee salary records are missing,” but it should not display the actual salary data. Access to the scorecard itself should be controlled, ensuring that only relevant personnel can view the metrics for the data they are responsible for.
Second, remember that a scorecard identifies problems; it does not automatically solve them. For complex data issues, a human-in-the-loop approach is essential. The scorecard might flag an inaccurate customer address, but a human service representative may need to make a phone call to get the correct information. The goal is to use the scorecard to direct human expertise to where it’s needed most, creating an efficient partnership between automated monitoring and human judgment.
Your Next Steps: From Scorecard to Action
Reading about data quality is useful, but taking action is what creates value. A Data Quality Scorecard moves your organization from a state of passive data consumption to active data stewardship. It builds a culture of accountability and provides the foundation for reliable analytics, effective automation, and trustworthy AI.
Don’t wait for a perfect, enterprise-wide solution. Start now with a focused, high-impact pilot. Here is your plan for the next 30 days:
- This Week: Choose one critical report or dashboard that your business relies on. Meet with the primary business user of that report and ask them, “How much do you trust this data? What information, if it were wrong, would cause the biggest problem?”
- Next Week: Based on that conversation, define and calculate three simple quality metrics using the pillars of Completeness, Accuracy, and Freshness. It can be as simple as a few SQL queries.
- Within 30 Days: Present your findings to the business owner. Establish a baseline score and agree on a realistic target for improvement. Assign a clear owner for the metric and schedule your next check-in.
By taking these small, concrete steps, you will begin the journey of transforming data from a passive liability into your organization’s most valuable strategic asset.
Your Next Read:
Category:
Get a FREE
Proof of Concept
& Consultation
No Cost, No Commitment!