

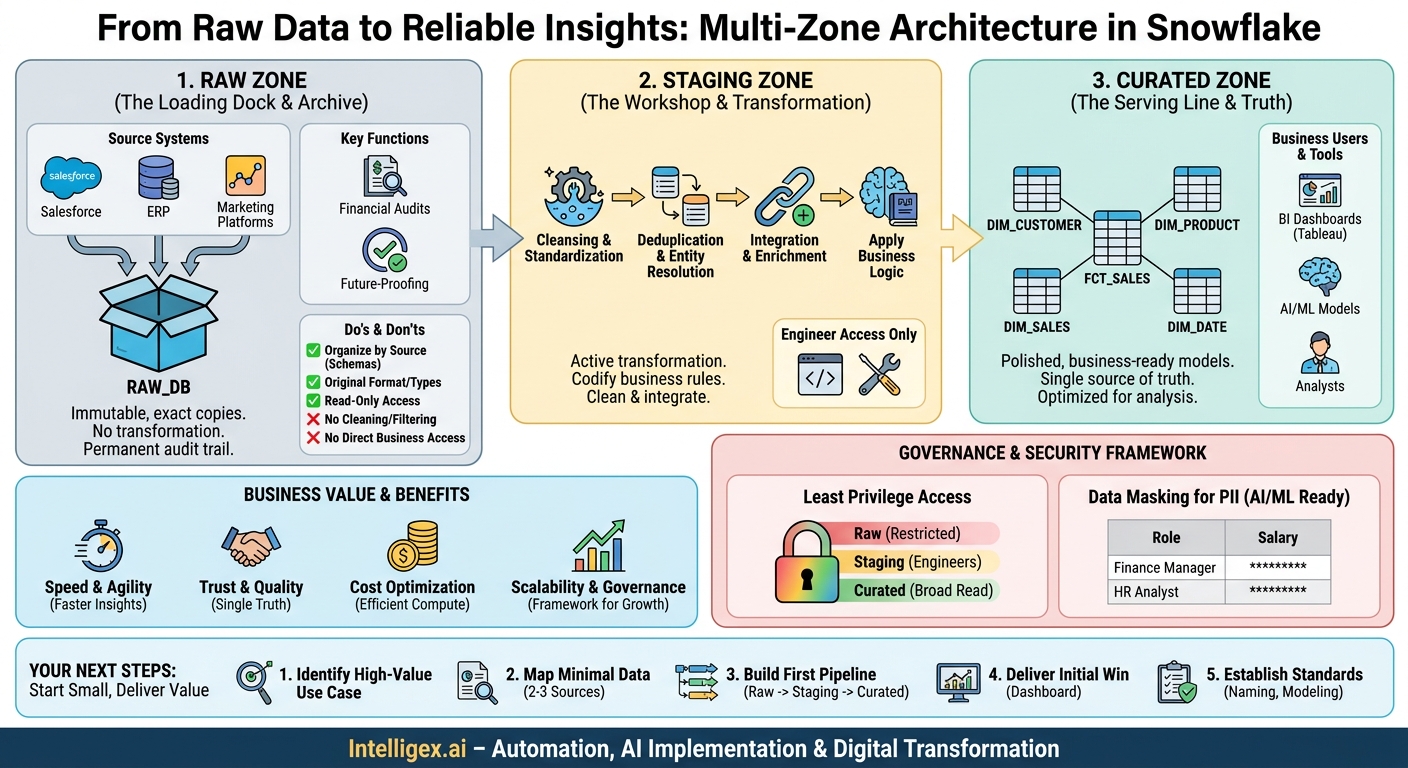
Your company’s data is a strategic asset, but for many organizations, it feels more like a liability. It’s scattered across dozens of applications, trapped in silos, and plagued by inconsistencies. When your finance team pulls a different revenue number than your sales team, trust erodes. When marketing can’t measure campaign ROI because customer data is fragmented, budgets are wasted. The result is slow, reactive decision-making in a market that demands speed and precision.
The problem isn’t a lack of data; it’s a lack of a coherent system for managing it. A well-designed data architecture is the foundation for turning raw information into reliable business intelligence. In Snowflake, one of the most effective and scalable patterns for achieving this is the multi-zone architecture, commonly structured as Raw, Staging, and Curated zones. This isn’t just a technical blueprint for engineers. It’s a business framework that directly improves data quality, accelerates insights, and reduces operational costs.
What is the Multi-Zone Architecture and Why Does It Matter?
Think of your data platform like a professional kitchen. You wouldn’t serve customers ingredients straight from the delivery truck. There’s a methodical process that ensures quality, consistency, and safety. The multi-zone architecture applies this same logic to your data.
- The Raw Zone is the loading dock. It’s where you receive all your raw ingredients (data) from various suppliers (source systems like Salesforce, your ERP, marketing platforms). The data is stored exactly as it arrived, untouched and in its original packaging.
- The Staging Zone is the prep station. Here, chefs (data engineers) wash, chop, and combine the ingredients. They clean the data, standardize formats, join different sources, and apply business logic. This is the messy but essential transformation work.
- The Curated Zone is the serving line. The finished dishes (business-ready data models) are presented here. They are well-structured, validated, and ready for consumption by your diners (business analysts, data scientists, and executive dashboards).
Adopting this structure delivers clear business value across several key areas:
Speed and Agility: When analysts know exactly where to find reliable, pre-processed data in the Curated zone, they can generate reports and insights in hours, not weeks. They no longer have to reinvent the wheel by cleaning and preparing the same raw data for every new request.
Trust and Quality: By formalizing the data refinement process, you create a single source of truth. The logic for calculating key metrics like “customer lifetime value” or “monthly recurring revenue” is defined once in the Staging zone and made available to everyone in the Curated zone. This eliminates debates over whose numbers are “right.”
Cost Optimization: Snowflake’s architecture separates storage from compute. The multi-zone design leverages this by isolating computationally expensive transformations in the Staging zone. You avoid running the same complex data cleaning jobs over and over again every time a user builds a new report. Data is processed once, stored efficiently, and queried many times.
Scalability and Governance: This model provides a clear framework for managing access and adding new data sources. As your company grows, you can integrate new systems into the Raw zone without disrupting the curated models your business relies on.
The Raw Zone: Your Foundation for Auditability
The primary rule of the Raw Zone is simple: load an exact, immutable copy of your source data and then leave it alone. This zone acts as your permanent historical archive. It is not meant for direct querying by business users, but its value as a foundation cannot be overstated.
Key Business Functions of the Raw Zone
The Raw Zone directly supports critical business needs that are often overlooked until it’s too late. It provides a permanent, auditable record of what your source systems reported at a specific point in time. This is invaluable for:
- Financial Audits: When auditors ask you to prove your revenue numbers, you can trace any figure in a final report all the way back to the original, unaltered transaction records from your billing and CRM systems.
- Data Recovery: If a transformation pipeline is built with flawed logic, you don’t need to re-ingest data from the source systems, which can be slow or even impossible. You simply correct the logic in the Staging zone and re-run it against the pristine data in the Raw Zone.
- Future-Proofing Analysis: A business question you don’t have today might become critical next year. For example, you may not track a specific marketing attribution field today, but the raw data containing it is being collected. By storing the full, unaltered records, you retain the ability to reprocess history and answer new questions as they arise.
Practical Do’s and Don’ts
Do:
- Create a dedicated database for this zone, for example
RAW_DB. - Organize data by source system using schemas (e.g.,
RAW_DB.SALESFORCE,RAW_DB.SAP,RAW_DB.GOOGLE_ANALYTICS). - Load data with its original column names and data types. Use a variant data type for semi-structured data like JSON to preserve its original form.
- Implement strict, read-only access for nearly all users. Only dedicated data ingestion service roles should have write permissions.
Don’t:
- Perform any data cleaning, filtering, or transformations during ingestion into this zone. Don’t even change a timestamp’s format.
- Allow business intelligence tools or general analysts to connect directly to this zone. The data is not ready for consumption and can be easily misinterpreted.
The Staging Zone: The Workshop for Transformation
If the Raw Zone is about preservation, the Staging Zone is all about transformation. This is the active workshop where data is shaped from its raw state into a structured, consistent, and integrated form. It’s the critical bridge that makes the data from many different systems usable together.
The work done here is technical, but its purpose is entirely business-driven. It’s where you codify your company’s unique definitions and rules. For example, what constitutes an “active customer”? How do you handle different currencies in sales data? How do you link a lead from your marketing system to a customer in your finance system? These rules are implemented in the Staging Zone.
A Step-by-Step Transformation Process
Building a reliable data model in the Staging Zone follows a repeatable process. Let’s take the common business need of creating a unified view of the customer.
- Source from Raw: Begin by selecting the necessary tables from the Raw Zone. For a customer view, this might be the
RAW_DB.SALESFORCE.CONTACTtable and theRAW_DB.ZENDESK.USERStable. - Basic Cleansing and Standardization: Create new models in the Staging Zone (e.g., in a schema like
STG_DB.COMMON). In these models, perform foundational cleaning. This includes trimming whitespace from text fields, casting data types (e.g., converting text-based dates into proper date formats), and standardizing values (e.g., converting ‘USA’, ‘U.S.’, and ‘United States’ all to a single ‘US’ country code). - Deduplication and Entity Resolution: This is a critical step. Using business rules, identify and merge duplicate customer records. You might use a priority system, such as “the record with the most recent activity is the master,” or match records based on a standardized email address.
- Integration and Enrichment: Join the cleaned data sets together. You can now link a customer’s support tickets from Zendesk to their contact record from Salesforce. You might also enrich the data by joining it with a public dataset to add demographic information based on postal codes.
- Apply Business Logic: Create higher-level columns that embed business logic. For example, add a calculated column named
IS_ACTIVEbased on the rule “a customer is active if they have placed an order in the last 12 months.”
The output of this process is a set of clean, integrated tables in the Staging Zone that are ready to be modeled for final consumption in the Curated Zone. Access to this zone is typically limited to data engineers and technical analysts who are responsible for building and maintaining these transformation pipelines.
The Curated Zone: Your Single Source of Business Truth
The Curated Zone is the destination. It’s the “storefront” for your data, containing polished, reliable, and easy-to-use datasets designed for business consumption. When your executive team looks at a dashboard, or an analyst builds a report in a tool like Tableau, they should be connecting to the Curated Zone. The data here is not only clean but also modeled for performance and clarity.
From Data to Actionable Intelligence
The models in this zone are often organized using dimensional modeling concepts, like fact and dimension tables, which are highly intuitive for business analysis.
- Dimension Tables (
DIM_): These tables describe the “who, what, where, when, and why” of your business. Examples includeDIM_CUSTOMER, which contains one row per unique customer with all their attributes, orDIM_PRODUCTwith details on each product you sell. They are descriptive and change infrequently. - Fact Tables (
FCT_): These tables contain the measurements, metrics, and transactions of your business. AFCT_SALEStable would contain one row per sales order line item, with numeric values like `quantity_sold` and `sale_amount`, along with keys that link to dimension tables (e.g., `customer_key`, `product_key`, `order_date_key`).
This structure makes it incredibly easy for a business user to answer complex questions. To find “total sales for Product X to customers in California last quarter,” a user can simply join the FCT_SALES table with DIM_PRODUCT, DIM_CUSTOMER, and DIM_DATE and apply the appropriate filters. The underlying complexity of joining and cleaning a dozen raw tables has already been handled.
Measuring Success in the Curated Zone
The ultimate metric for the Curated Zone is data adoption. Success isn’t just about building the models; it’s about people using them to make better decisions. You can track this by monitoring:
- Query Volume: Are users and BI tools actively querying the curated tables?
- User Diversity: Which departments are using the data? A successful curated layer serves teams across the organization, from finance to marketing to operations.
- Reduction in “Shadow IT”: Are you seeing a decrease in analysts exporting raw data to Excel to create their own versions of the truth? The Curated Zone should become the path of least resistance for getting reliable answers.
Ensuring Security and Governance Across Zones
A zoned architecture is not just a data flow pattern; it’s a powerful security and governance framework. By separating data based on its refinement level, you can implement granular access controls that protect sensitive information while empowering users with the data they need.
The guiding principle is least privilege: grant users access only to the data zone required for their role.
- Raw Zone: Access is the most restrictive. Only automated ingestion processes should have write permissions. Read access is limited to a small group of data engineers who need to validate source data.
- Staging Zone: Data engineers and developers have read/write access here to build and test transformation logic. It’s their workshop.
- Curated Zone: This zone has the broadest read access. BI tools, service accounts for applications, and business analysts across the company are granted read-only permissions to the specific data models relevant to their function.
Protecting Sensitive Data for AI and Analytics
This model is especially critical when dealing with Personally Identifiable Information (PII) or other sensitive data. Snowflake provides powerful, column-level security features that integrate seamlessly with the zoned architecture. For example, using features like Dynamic Data Masking, you can create a single policy that applies to a column like `employee_salary` in the CURATED_DB.HR.DIM_EMPLOYEE table.
The policy can state that:
- A user with the `HR_ANALYST` role sees the full, unmasked salary.
- A user with the `FINANCE_MANAGER` role sees a masked value (e.g., `*********`).
- Any other user sees a null value or is denied access to the row entirely via a Row-Access Policy.
This approach is essential for safely preparing data for AI and machine learning models. It ensures that models are trained only on the data they are permitted to see, providing an auditable and secure foundation for advanced analytics while protecting individual privacy.
Your Next Steps to a Zoned Data Architecture
Implementing a multi-zone architecture doesn’t require a massive, multi-year overhaul. The most successful projects start small, deliver value quickly, and expand incrementally. By demonstrating the power of this approach on a single, high-impact business problem, you can build the momentum and stakeholder support needed for a broader rollout.
Here is a practical action plan to get started:
- Identify a High-Value Use Case: Don’t try to model your entire business at once. Partner with a business unit and pick one critical challenge. Examples include creating a unified view of the customer journey for marketing, calculating product profitability for finance, or tracking inventory levels for the supply chain team.
- Map the Minimal Data: For your chosen use case, identify the 2-3 source systems that hold the most important data. Focus only on what’s necessary to solve this one problem.
- Build Your First Pipeline: Set up the three databases in Snowflake:
RAW_DB,STAGING_DB, andCURATED_DB. Build the ingestion and transformation logic to move the data for your use case through the zones. - Deliver an Initial Win: Connect a BI tool to the new curated model and deliver a single, powerful dashboard that was previously difficult or impossible to create. When the sales leader sees a reliable funnel report or the operations manager sees an accurate daily inventory snapshot, they become your biggest champion.
- Establish and Document Standards: As you build, document your decisions. Create a simple guide for naming conventions (e.g., `FCT_` for facts, `DIM_` for dimensions), data modeling patterns, and access control policies. This initial effort will ensure your platform remains organized and scalable as you add more data and use cases.
By following this structured, business-first approach, you can move your organization’s data from a chaotic liability to its most powerful and reliable asset, driving smarter decisions and a true competitive advantage.
Your Next Read:
Category:
Get a FREE
Proof of Concept
& Consultation
No Cost, No Commitment!
