Your company’s revenue data is a strategic asset, but for many businesses, it remains locked away inside the Stripe dashboard. While excellent for day-to-day operations and high-level summaries, the standard interface makes it difficult to answer complex, cross-functional questions. You can see what happened, but understanding why it happened requires a deeper look. When you can’t easily combine payment data with information from your CRM, product analytics, or marketing platforms, you’re making critical decisions with an incomplete picture.
This limitation creates hidden friction across the organization. Your finance team might spend days manually exporting CSV files to reconcile accounts. Your marketing team may struggle to calculate the true lifetime value (LTV) of customers from different acquisition channels. Your customer success team might only learn about a payment issue after a customer has already churned. To move from reactive reporting to proactive strategy, you need to liberate your Stripe data and place it at the heart of your analytics environment. Centralizing this data in a powerful data warehouse like Google BigQuery transforms it from a simple transaction log into a predictive tool for monitoring payment health and reducing customer churn.
Why Your Stripe Data Deserves More Than a Dashboard
The standard Stripe dashboard is designed for operational speed, not deep, exploratory analysis. It excels at showing you current MRR, recent payments, and failed charges. But what happens when you need to answer more strategic questions? Questions that require a broader context?
Consider these common business challenges:
- Understanding Involuntary Churn: A customer didn’t actively cancel their subscription; their payment simply failed. Why? Was it a specific type of card? Is there a pattern among customers from a certain region? The Stripe dashboard shows the failure, but it can’t easily correlate it with other customer attributes stored in your CRM.
- Accurate Financial Forecasting: To build a reliable forecast, your finance team needs to model payment trends, seasonality, and the impact of dunning (the process of communicating with customers to collect overdue payments). This requires historical data and the ability to run complex queries, which is cumbersome with siloed transaction data.
- Optimizing Marketing Spend: Your marketing team wants to know which campaigns attract the most profitable customers. This means connecting acquisition channel data (from Google Analytics or your ad platforms) with long-term revenue data from Stripe. Without a central data warehouse, this is a difficult and manual task, often leading to decisions based on gut feelings rather than hard numbers.
By keeping your Stripe data isolated, you create information gaps. Every team builds its own partial view of customer and revenue health, leading to misalignment and missed opportunities. The solution is to create a single source of truth where payment data can be analyzed alongside every other aspect of your business.
The Power Couple: Stripe and Google BigQuery
Connecting your Stripe account to a cloud data warehouse is the most effective way to unlock its full value. The combination of Stripe as the data source and Google BigQuery as the destination is particularly powerful for several key reasons that deliver tangible business value.
Stripe is the source of truth for revenue. It captures an incredibly rich and granular dataset. This includes every subscription change, invoice, payment attempt, refund, dispute, and payout. These are not just financial records; they are signals about customer behavior and health.
Google BigQuery is built for scale and speed. As a serverless, petabyte-scale data warehouse, BigQuery is designed to handle massive datasets without requiring you to manage any infrastructure. This has direct business benefits:
- Cost-Effectiveness: You only pay for the data you store and the queries you run. For many businesses, this is far more economical than maintaining a traditional data warehouse, especially as data volume grows.
- Unmatched Speed: BigQuery can scan terabytes of data in seconds. This means your teams get answers to their questions almost instantly, enabling a more agile and data-driven culture. No more waiting hours for a complex report to run.
- Seamless Integration: It is a core part of the Google Cloud Platform, making it easy to connect with visualization tools like Looker Studio, run machine learning models with BigQuery ML, and join your Stripe data with other sources like Google Analytics 4.
Together, Stripe and BigQuery create an analytical engine that scales with your business. When all your payment data is structured and accessible in BigQuery, you can move beyond simple dashboards. You can build comprehensive models for churn prediction, customer segmentation, and financial reconciliation that were previously out of reach.
Setting Up the Data Pipeline: A Practical Walkthrough
Getting data from Stripe into BigQuery requires establishing a data pipeline. This process automatically extracts, transforms, and loads (ETL) data on a schedule you define. While the technical details can vary, the overall process follows a few key steps. The goal is to create a reliable, automated flow of information that requires minimal manual intervention once it is set up.
Here is a high-level, step-by-step approach to building your pipeline:
- Choose Your Integration Method
You have two primary options: using a third-party ETL connector or building a custom solution. A “build vs. buy” decision depends on your team’s resources and needs.- ETL Connectors (The “Buy” Option): Tools like Fivetran, Stitch, or Airbyte offer pre-built Stripe to BigQuery connectors. They handle authentication, schema management, and scheduling for you. This is the fastest and often most reliable way to get started, though it comes with a subscription cost. It’s ideal for teams that want to focus on analysis, not pipeline maintenance.
- Custom Solution (The “Build” Option): You can use the Stripe API directly with custom code (e.g., Python scripts running on Cloud Functions) to pull data and load it into BigQuery. This approach offers maximum flexibility and control but requires engineering resources to build and maintain. It’s suitable for companies with very specific data transformation needs or existing in-house data engineering expertise.
- Authenticate and Configure the Stripe Source
Once you’ve chosen a method, you will need to securely connect to your Stripe account. This typically involves using API keys. It is crucial to create a restricted API key that only has read-only access to the data you need. You will then select which Stripe data objects to sync. A good starting point includes Customers, Subscriptions, Invoices, Charges, Payouts, and Balance Transactions. - Define the BigQuery Destination and Schema
In your Google Cloud project, you’ll create a BigQuery dataset to house your Stripe data. Your integration tool will typically suggest a schema for each table (e.g., a `subscriptions` table, a `customers` table). It is a best practice to review these and ensure they align with your business logic. For instance, you might want to ensure that custom metadata from Stripe is included in the sync. - Schedule and Monitor the Initial Sync and Incremental Updates
The first time the pipeline runs, it will perform a historical sync, pulling all past data from Stripe. This can take some time depending on your transaction volume. After that, the pipeline will run on a schedule you set (e.g., every hour, every 6 hours, or once a day) to pull only the new or updated data. Monitor the first few runs to ensure data is flowing correctly and there are no errors.
With this pipeline in place, your BigQuery dataset will always contain a fresh, structured copy of your Stripe data, ready for analysis.
Key Metrics to Track: From Payment Failures to Churn Signals
Once your Stripe data is in BigQuery, you can start calculating metrics that reveal the true health of your revenue operations. These go far beyond the surface-level numbers available in a standard dashboard. By writing SQL queries or connecting a business intelligence tool, you can build reports that drive action.
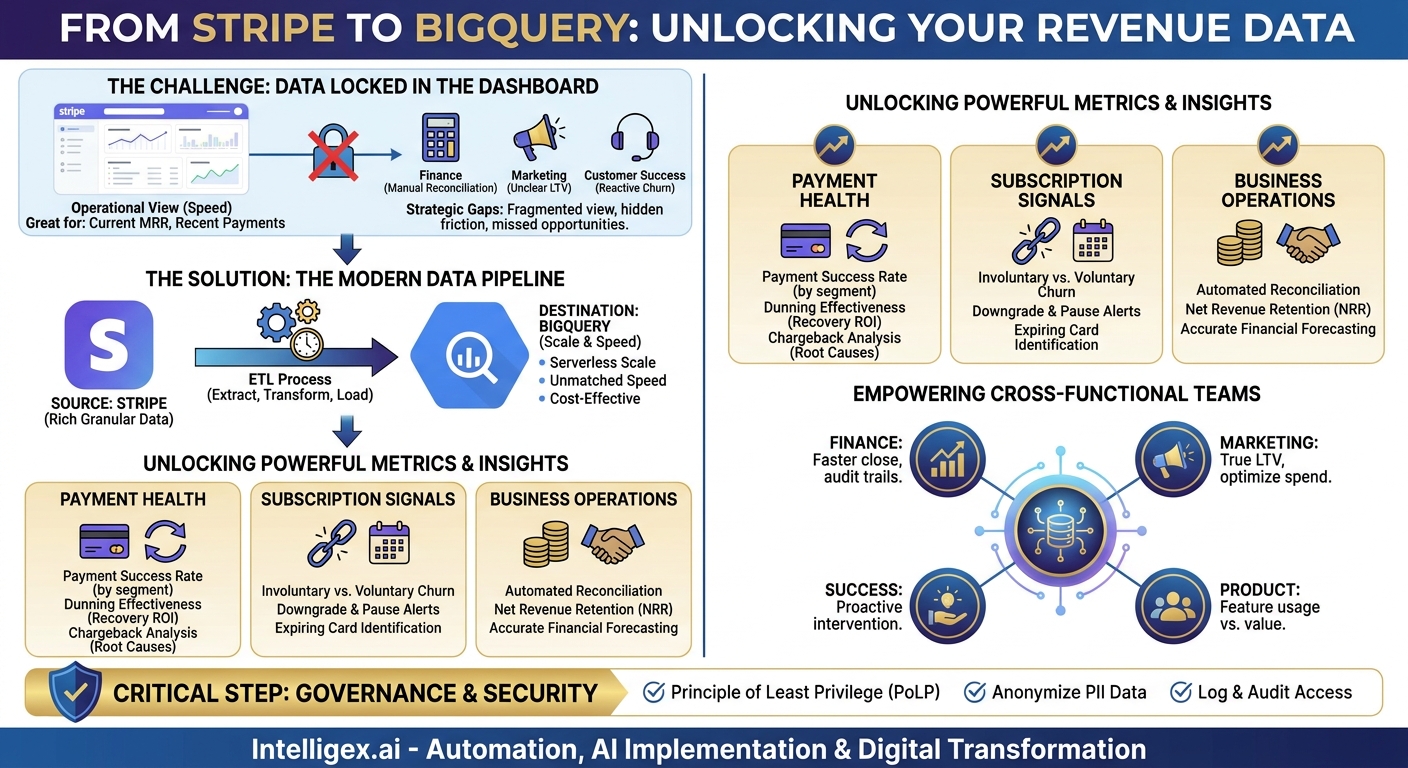
Payment Health Metrics
These metrics help you understand the efficiency and reliability of your payment processing. They are leading indicators of potential revenue leakage and customer friction.
- Payment Success Rate: The percentage of successful charges out of total attempts. In BigQuery, you can segment this by card brand (Visa, Amex), country, or even by the product purchased to identify specific points of failure.
- Dunning Effectiveness: Of the subscriptions that enter a dunning cycle after a failed payment, what percentage are ultimately recovered? This directly measures the ROI of your recovery efforts.
- Chargeback Rate by Reason: Analyzing the reason codes provided for chargebacks (e.g., “fraudulent,” “product not received”) helps you identify root causes, whether they are related to deceptive advertising, unclear billing descriptors, or product issues.
Subscription and Churn Signals
This is where you can be most proactive. By identifying at-risk customers before they leave, you can intervene and save valuable recurring revenue.
- Involuntary vs. Voluntary Churn: Separating customers who actively cancel from those who churn due to payment failure is critical. Involuntary churn is often preventable, and a high rate points to correctable issues in your payment and recovery process.
- Subscription Downgrades and Pauses: Tracking the rate at which customers move to lower-priced plans or pause their subscriptions can be an early warning signal of dissatisfaction or changing customer needs.
- Customers with Expiring Cards: A simple query can generate a list of all customers whose saved credit card is set to expire in the next 30 or 60 days. Your customer success team can use this list for proactive outreach.
Business Operations Metrics
Connecting Stripe data to your operational processes allows you to improve efficiency and financial accuracy.
- Payout Reconciliation: By joining Stripe payout reports with transaction data, your finance team can automate the reconciliation of funds received in your bank account against the specific charges, fees, and refunds they represent.
- Net Revenue Retention (NRR): This crucial SaaS metric measures revenue from existing customers, factoring in upgrades, downgrades, and churn. Calculating NRR accurately requires detailed historical subscription data, which is readily available in BigQuery.
How Different Teams Can Use This Integrated Data
A centralized data warehouse for payment information breaks down departmental silos and empowers every team to make better decisions. When everyone is working from the same trusted dataset, collaboration improves and strategies become more aligned.
Finance and Operations: For the finance team, this integration is a game-changer. Month-end closing becomes faster and more accurate. Instead of manual data exports, they can build automated reports that reconcile Stripe payouts with bank statements and accounting software. This creates a clear audit trail and reduces the risk of human error. The operations team can monitor payment success rates in real-time and quickly identify and address systemic issues, like a sudden increase in failures from a specific payment gateway.
Marketing and Sales: With Stripe data in BigQuery, the marketing team can finally close the loop on their campaigns. By joining ad platform data with subscription data, they can calculate the LTV of customers acquired through different channels. This allows them to optimize ad spend for long-term profitability, not just initial signups. The sales team can use churn signal reports to identify high-value accounts at risk, allowing them to intervene with targeted support or special offers.
Customer Success and Product: Proactivity is key for customer success. Instead of waiting for an angry customer to call about a failed payment, the team can use a dashboard to see whose payment is likely to fail next. They can reach out to customers with expiring cards or those who have had multiple recent declines. The product team can correlate subscription events (like upgrades or downgrades) with product usage data. This helps them understand which features drive value and which ones might be causing customers to reconsider their subscription level.
Data Governance and Security: A Non-Negotiable Step
Stripe data contains sensitive customer and financial information, including Personally Identifiable Information (PII). When you move this data into a central warehouse like BigQuery, establishing strong governance and security practices is not just a best practice; it is a requirement for protecting your customers and your business.
A well-governed data environment ensures that data is accurate, secure, and used responsibly. It builds trust and mitigates risk. Before you provide broad access to this data, implement a clear governance framework.
Here is a short checklist to guide your security and governance efforts:
- Implement the Principle of Least Privilege (PoLP): Grant users and services access only to the data they absolutely need to perform their jobs. Use BigQuery’s robust IAM (Identity and Access Management) controls to set permissions at the project, dataset, and even table level.
- Anonymize or Pseudonymize PII: Not everyone needs to see a customer’s full name, email, or address. For analytical purposes, you can often use a non-identifiable customer ID. Consider creating views in BigQuery that mask or omit PII for general analyst access, while restricting access to the raw tables.
- Establish Clear Data Retention Policies: Define how long you need to store raw transaction data and set up automated policies to archive or delete data that is no longer required for business or compliance reasons.
- Log and Audit Data Access: Use Google Cloud’s audit logs to track who is querying your sensitive data and when. This creates accountability and helps you detect any unusual activity quickly.
- Ensure a Human-in-the-Loop: If you build automated actions based on this data (e.g., sending an email to a customer at risk of churn), ensure there is a process for human review. Automation is powerful, but it can create poor customer experiences if not implemented thoughtfully.
Getting Started: Your Next Steps
Integrating Stripe and BigQuery is a foundational step in building a data-driven culture. It moves your organization from looking in the rearview mirror at historical reports to looking ahead, using leading indicators to prevent problems and seize opportunities. The goal is to empower your teams with the insights they need to improve efficiency, protect revenue, and deliver a better customer experience.
This project doesn’t have to be a massive, multi-quarter initiative. You can start small and deliver value quickly.
Here is a simple action plan to begin:
- Identify Your Top Business Questions: Start by defining 2-3 critical questions you currently can’t answer. For example, “Which customer segment has the highest rate of involuntary churn?” or “What is the 90-day LTV of customers from our latest marketing campaign?”
- Inventory Your Data Sources: Make a list of the data you’ll need to answer those questions. This will likely include Stripe, but also data from your CRM, marketing platforms, or product analytics tools.
- Evaluate Your Integration Path: Assess your internal resources. Is a pre-built ETL connector the right choice for speed, or do you have the engineering capacity to build a custom solution?
- Launch a Focused Proof-of-Concept: Start with a single, high-impact use case. Build the pipeline for a few key Stripe data objects and create one or two dashboards to answer your initial questions. This will demonstrate value quickly and build momentum for a broader rollout.
Your Next Read:
Category:
Get a FREE
Proof of Concept
& Consultation
No Cost, No Commitment!