Your finance team just closed the quarter, but the final revenue report is already being questioned. Sales leadership has one version of annual recurring revenue (ARR) based on Salesforce opportunities, while finance has another based on recognized revenue from the ERP. The result is a time-consuming, manual reconciliation process that delays critical decisions and erodes trust in your data. If this scenario sounds familiar, you’re not alone. For most growing companies, Salesforce is the heart of the customer relationship, but it doesn’t hold the entire financial story.
Relying on manual CSV exports and complex spreadsheets to bridge this gap is a recipe for error, inefficiency, and strategic blindness. To achieve reliable revenue reporting that the entire business can trust, you need to create a single source of truth. Integrating your Salesforce data with a cloud data platform like Snowflake provides a scalable and automated foundation for real-time, comprehensive business intelligence.
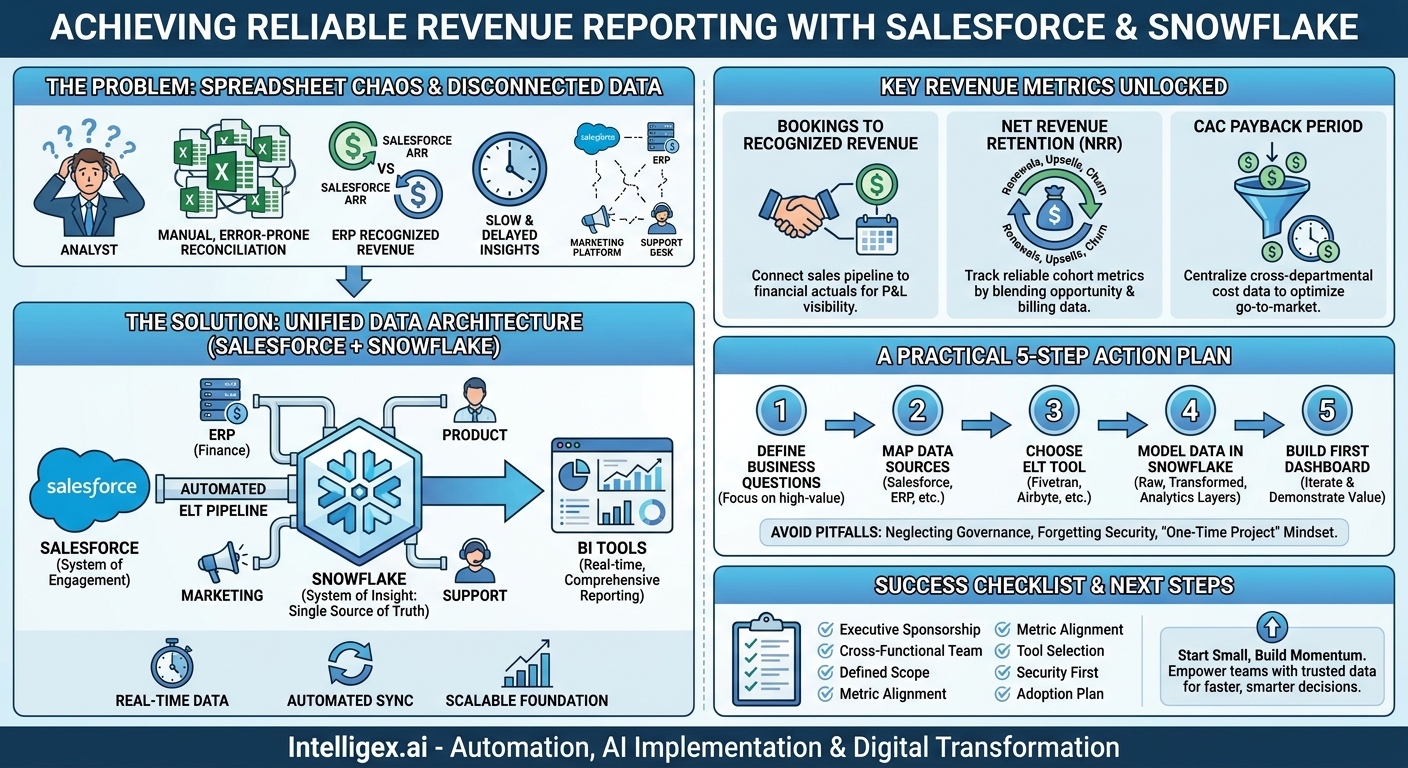
Why Your Spreadsheets Can’t Keep Up Anymore
For a while, the weekly ritual of exporting Salesforce reports into Excel works. A skilled analyst can use VLOOKUPs and pivot tables to merge sales data with financial actuals. But as your company scales, this manual process quickly becomes a significant bottleneck. It’s not just inefficient; it’s actively holding your business back.
The core problem lies in three areas: data quality, speed, and scalability. Manual data handling is prone to human error. A single copy-paste mistake or a broken formula can lead to incorrect reports that misinform executive strategy. The process is also incredibly slow. By the time your operations team finishes compiling a quarterly business review deck, the live data in Salesforce has already changed, making your analysis obsolete before the meeting even starts.
This approach simply does not scale. As you add new products, enter new markets, or acquire other companies, the complexity of your data explodes. The spreadsheet that took a day to update now takes a week, and its size makes it unstable and prone to crashing. You can’t run a multi-million dollar business on a system that depends on one person not accidentally deleting a crucial column.
A Common Scenario: The Disconnected Customer View
Imagine your Head of Customer Success wants to identify at-risk accounts. They need to see which customers have a high number of open support tickets (from a system like Zendesk), low product usage (from your application database), and upcoming renewal dates (from Salesforce). In a spreadsheet-driven world, getting this answer requires three separate exports and a frantic data-stitching exercise. The resulting list is static and quickly outdated. By contrast, a unified data platform can deliver this insight on a live dashboard, enabling proactive intervention rather than reactive damage control.
The Salesforce + Snowflake Architecture: A Foundation for Truth
Integrating Salesforce and Snowflake creates a modern data architecture designed for clarity and performance. Think of it this way: Salesforce remains your system of engagement, the place where your sales, service, and marketing teams interact with customers. Snowflake becomes your system of insight, a central, high-performance repository where Salesforce data can be combined with data from every other part of your business.
The process works by establishing an automated data pipeline. Using an Extract, Load, Transform (ELT) tool, data from your Salesforce objects (like Accounts, Opportunities, Contacts, and custom objects) is copied into Snowflake. This isn’t a one-time dump; it’s a continuous synchronization that keeps your Snowflake data warehouse up to date with changes happening in Salesforce in near real-time.
Once in Snowflake, the real value emerges. You can now join your Salesforce data with:
- Financial Data: Invoice and payment records from your ERP (e.g., NetSuite, SAP) to compare what was sold with what was billed and collected.
- Marketing Data: Campaign performance, lead sources, and spend from platforms like Marketo or Google Analytics to calculate a true marketing ROI and customer acquisition cost.
- Product Usage Data: Telemetry from your application to understand which features drive adoption and renewals.
- Support Data: Ticket volumes and customer satisfaction scores to correlate service quality with customer lifetime value.
This unified dataset provides unparalleled visibility. Instead of arguing about whose numbers are right, your teams can focus on what the numbers mean for the business. The cost benefits are also significant. You reduce the immense labor cost of manual reporting and, more importantly, avoid the high opportunity cost of making strategic decisions based on slow, incomplete, or inaccurate information.
Key Revenue Metrics You Can Finally Track Reliably
Moving beyond basic Salesforce reports unlocks the ability to track sophisticated, cross-functional metrics that truly reflect business health. A combined Salesforce and Snowflake environment makes these calculations automated and trustworthy.
From Bookings to Recognized Revenue
Salesforce excels at tracking bookings (the value of a signed contract), but finance cares about recognized revenue (when the service is delivered and money can be counted according to accounting standards). By joining Salesforce Opportunity data with invoice schedules and payment records from your ERP in Snowflake, you can build dashboards that show both metrics side-by-side, providing a complete picture of your sales pipeline and its impact on the company’s P&L.
Net Revenue Retention (NRR)
NRR is a critical metric for any subscription business, but it’s notoriously difficult to calculate using only Salesforce data. A true NRR calculation requires you to track renewals, upsells, downsells, and churn against a customer cohort. This involves blending Salesforce opportunity data (for expansion deals) with billing data (to confirm cancellations and payment changes). In Snowflake, you can model this logic once and have a reliable, always-on NRR report segmented by customer size, industry, or product line.
Customer Acquisition Cost (CAC) Payback Period
How long does it take to earn back the money you spent to acquire a new customer? Answering this requires data from multiple departments. You need sales and marketing expenses (from your finance and ad platforms), salesperson commissions (from your HR or compensation system), and the gross margin of new bookings (from Salesforce and your ERP). By centralizing this data, you can move beyond a simple, blended CAC and start analyzing payback periods by marketing channel, sales team, or customer segment to optimize your go-to-market spend.
A Practical 5-Step Plan to Get Started
Embarking on a Salesforce and Snowflake integration can feel daunting, but a phased approach focused on immediate business value makes it manageable. Follow these steps to build momentum and deliver results quickly.
- Define Your Core Business Questions. Don’t start by trying to replicate every existing report. Instead, gather stakeholders from finance, sales, and operations and identify the top 3-5 critical questions they cannot answer today. Focus on high-value problems. Examples include: “Which marketing campaigns generate the highest lifetime value customers?” or “What is our real-time forecast for bookings versus our financial plan?”
- Identify and Map Your Data Sources. For each question you defined, list the systems that hold the necessary data. Be specific. For a CAC Payback report, you’ll need the Opportunity object from Salesforce, the Spend table from your Google Ads account, and the Invoices table from your ERP. Documenting these sources is the blueprint for your integration pipeline.
- Choose Your Integration Method (ETL/ELT). You need a tool to move data from your sources into Snowflake automatically. Modern ELT (Extract, Load, Transform) platforms like Fivetran, Airbyte, or Matillion are often a good choice. They provide pre-built connectors for popular sources like Salesforce, which greatly simplifies the initial setup. These tools handle the “Extract” and “Load” parts, letting your team focus on the “Transform” stage within Snowflake, where the real business logic is applied.
- Structure and Model Your Data in Snowflake. Don’t just dump raw data into one place. A best practice is to use a layered approach. Create a “raw” or “staging” layer that contains an exact copy of the source data. Next, create a “transformed” or “integration” layer where you clean, join, and apply business logic to the raw data. Finally, create a “reporting” or “analytics” layer with simplified, aggregated views (often called data marts) optimized for your business intelligence (BI) tools. This structure makes your data reliable, reusable, and easy for analysts to query.
- Connect Your BI Tool and Build the First Dashboard. This is the payoff. Connect your BI tool of choice (such as Tableau, Power BI, or Looker) to the analytics layer you created in Snowflake. Build a dashboard that directly answers one of the critical business questions from Step 1. Share it with your stakeholders, gather feedback, and iterate. This first win demonstrates the value of the platform and builds support for expanding the initiative.
Common Pitfalls and How to Avoid Them
A successful data platform project is about more than just technology. It requires a focus on people, processes, and governance. Be aware of these common challenges from the start.
Pitfall: Neglecting Data Governance
The Problem: You build a beautiful pipeline, but the data is still untrustworthy because different teams have different definitions for the same metric. Sales calculates ARR one way, and finance calculates it another. Without a shared understanding, your single source of truth becomes a single source of confusion.
The Solution: Establish a data governance council with representatives from each key business function. Their first task should be to create a data dictionary that provides clear, unambiguous definitions for your top 10-20 company metrics. Document these definitions and make them easily accessible to everyone who consumes data.
Pitfall: Forgetting About Security and Compliance
The Problem: You are centralizing highly sensitive customer and financial information. A breach or unauthorized access could have severe consequences. Simply granting everyone access to everything is not a viable security strategy.
The Solution: Implement a robust security model from day one. Use Snowflake’s Role-Based Access Control (RBAC) to ensure that users can only view and query the data relevant to their roles. For example, a sales manager might see aggregated data for their team, but not the underlying personally identifiable information (PII) of every customer. Use data masking techniques to obscure sensitive fields like names or contact information in development and testing environments.
Pitfall: The “One-Time Project” Mindset
The Problem: The integration is treated as a finite IT project with a start and end date. Once the first dashboard is built, the project is considered “done,” and the team disbands. The business evolves, new questions arise, but the data platform remains static and slowly loses its relevance.
The Solution: Treat your data platform as a living product, not a one-off project. It requires continuous improvement and investment. Create a roadmap for adding new data sources, developing new data models, and building new reports based on evolving business needs. Assign clear ownership for the platform’s ongoing health and development.
Checklist for a Successful Implementation
Use this short checklist to keep your integration project on track and focused on business outcomes.
- Executive Sponsorship: Have you secured active support from leaders in both Finance and Sales?
- Cross-Functional Team: Is your project team composed of members from IT/Data Engineering, Revenue/Sales Ops, Finance, and BI/Analytics?
- Defined Scope: Have you started with a narrow scope focused on answering 1-2 high-impact business questions?
- Metric Alignment: Are key metric definitions (like “ARR” or “Active Customer”) agreed upon and documented by all stakeholders?
- Tool Selection: Have you evaluated and selected an ELT tool that fits your team’s technical skills and budget?
- Security First: Is a plan for role-based access control and data security in place before any sensitive data is moved?
- Adoption Plan: Do you have a plan for training business users on how to access and interpret the new dashboards?
Your Next Steps
Moving from fragmented spreadsheets to a unified data platform is a transformational step that replaces ambiguity with clarity. It empowers your teams to make faster, smarter decisions and frees up your best analysts from tedious data wrangling to focus on generating strategic insights.
To begin, don’t wait for a perfect, all-encompassing plan. Start small and build momentum. Schedule a meeting with your heads of Finance and Sales Operations and ask them a simple question: “If you could have a perfectly accurate, real-time answer to any question about our revenue, what would you ask first?” Their answer is the starting point for your journey. A focused proof-of-concept, perhaps integrating just Salesforce Opportunities with ERP invoices, can demonstrate tangible value in weeks, not months.
Building a scalable and reliable data foundation is a specialized discipline. Partnering with experts who have navigated these integrations can help you accelerate your timeline, avoid common technical and organizational hurdles, and ensure your investment delivers lasting business value.
Your Next Read:
Category:
Get a FREE
Proof of Concept
& Consultation
No Cost, No Commitment!