

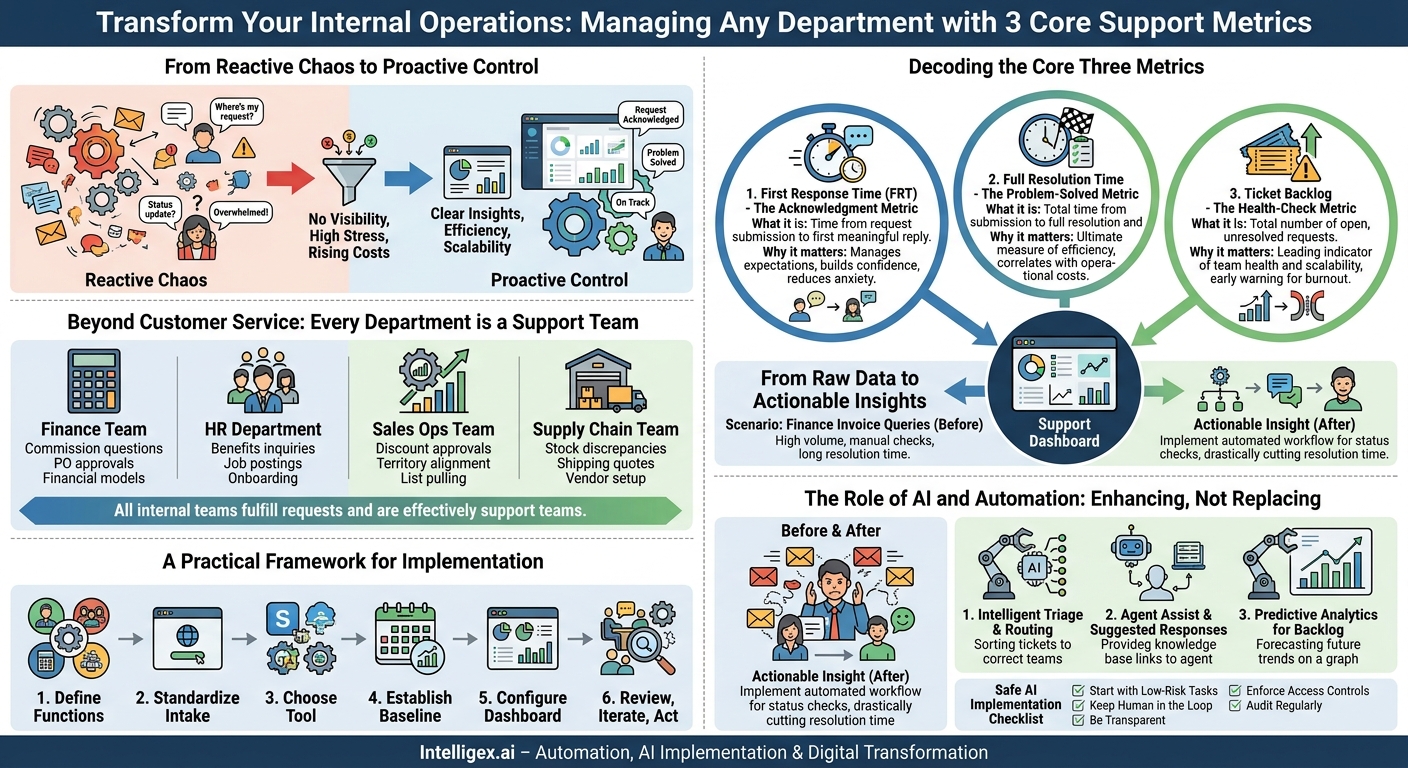
Every modern business runs on requests. An employee needs access to a new software tool. A manager needs a budget variance report from finance. A salesperson needs help configuring a complex quote. These aren’t just one-off tasks; they are the gears of your internal operations. When these gears grind slowly or get stuck, productivity suffers, costs rise, and frustration builds. The problem is that most departments outside of traditional customer service lack a system for managing this internal “support” load. They rely on scattered emails, instant messages, and hallway conversations, leaving them with no visibility into the volume, urgency, or status of their work.
To move from reactive chaos to proactive control, you need data. Specifically, you need to track three foundational metrics: First Response Time, Full Resolution Time, and Ticket Backlog. These aren’t just for customer-facing call centers. They are the vital signs for any team that provides a service to another part of the business, from IT and HR to finance and operations. By building a dashboard around these core metrics, you can unlock profound improvements in speed, cost, quality, and scalability across your entire organization.
Beyond Customer Service: Why Every Department is a Support Team
The concept of “support” is often narrowly defined as helping external customers with a product. This perspective misses the bigger picture. Any team that fulfills requests for others is, in effect, a support team. Their “customers” are their internal colleagues, and their “product” is their expertise and service. When you apply a support framework to these internal functions, you create clarity and efficiency where there was once ambiguity.
Consider these common scenarios:
- The Finance Team: A sales director questions a commission calculation. A project manager needs a purchase order approved. An executive requests a custom financial model. These are all “tickets” that require a timely and accurate response.
- The HR Department: An employee has a question about their benefits enrollment. A hiring manager needs a job description posted. A new hire needs onboarding paperwork processed. Each request has a lifecycle, from submission to resolution.
- The Sales Operations Team: A sales representative needs a discount approved. Another needs help with territory alignment in the CRM. The marketing team needs a list pulled for a new campaign. These are critical requests that directly impact revenue generation.
- The Supply Chain Team: A warehouse manager reports a stock discrepancy. A logistics coordinator needs an expedited shipping quote. A procurement specialist requests a new vendor be added to the system. Delays here can have a direct impact on the company’s ability to deliver its products.
In all these cases, a lack of a structured process leads to the same problems: requests get lost in inboxes, there’s no way to prioritize urgent issues, and no one has a clear view of the team’s workload. By adopting a dashboard that tracks response times, resolution times, and backlogs, these departments can transform their service delivery, manage their capacity, and demonstrate their value to the organization in concrete, measurable terms.
Decoding the Core Three: Response, Resolution, and Backlog
These three metrics form the foundation of any effective support dashboard. They work together to give you a comprehensive picture of your team’s health, telling a story about your speed, efficiency, and capacity. Understanding each one is the first step toward using them to drive real business improvements.
First Response Time (FRT): The Acknowledgment Metric
What it is: First Response Time measures the duration from when a request is submitted to when the requester receives their first meaningful, non-automated reply. It answers the question: “How long does it take for us to acknowledge a new request?”
Why it matters: A fast FRT is about managing expectations and building confidence. It tells the requester, “We see you, we’ve logged your issue, and we are on it.” This immediate acknowledgment can significantly reduce anxiety and prevent follow-up emails or messages asking for a status update. This directly impacts the perception of service quality. Even if the final solution takes time, a quick initial response signals that the process has begun.
What to measure:
- Average FRT across all requests.
- FRT by priority (high-priority requests should have a much lower target FRT).
- FRT by channel (requests from a real-time channel like chat should be answered faster than email).
A common pitfall is to rely on a generic auto-reply like “Your request has been received” and count that toward your FRT. This is counterproductive. The response should be from a human or an intelligent system that provides an update, asks a clarifying question, or sets a clear expectation for the next step. A good response is better than a fast, empty one.
Full Resolution Time (FRT): The Problem-Solved Metric
What it is: Full Resolution Time, sometimes called Time to Resolution, measures the total time from when a request is first submitted until it is fully resolved and closed.
Why it matters: This is the ultimate measure of efficiency. While response time is about perception, resolution time is about execution. It directly correlates with the amount of effort and labor required to handle a request, making it a critical metric for managing operational costs. A consistently high resolution time can indicate process bottlenecks, a need for better training, or understaffing.
What to measure:
- Average Resolution Time by category (e.g., password resets vs. new hardware requests).
- First Contact Resolution (FCR) Rate (the percentage of requests solved with a single interaction).
- Resolution Time outliers (which tickets are taking an exceptionally long time and why?).
The primary danger here is incentivizing speed over quality. If a team is pushed to lower resolution times at all costs, they might close tickets prematurely or provide superficial fixes that don’t address the root cause. This leads to frustrated colleagues and repeat tickets, which ultimately drives up the total workload and inflates the backlog.
Ticket Backlog: The Health-Check Metric
What it is: The backlog is the total number of open, unresolved requests at any given point in time. It’s the queue of work waiting to be done.
Why it matters: The backlog is a leading indicator of your team’s health and scalability. A steadily growing backlog signals that your incoming request volume is greater than your team’s capacity to resolve them. It’s an early warning system for burnout, process failures, or emerging systemic issues. For example, a sudden spike in IT tickets related to a specific application could indicate a serious bug that needs immediate attention from the development team.
What to measure:
- Total number of open tickets.
- Backlog growth rate (new tickets vs. closed tickets over time).
- Ticket aging (how many tickets are less than 24 hours old, 1-3 days old, over a week old?).
Simply looking at the total number of backlog tickets can be misleading. A backlog of 100 new tickets is healthy. A backlog of 100 tickets that are all over a month old is a crisis. Analyzing the age of your backlog is crucial for understanding its true severity and prioritizing which issues to tackle first.
A Practical Framework for Implementing Your Support Dashboard
Transitioning from an ad-hoc process to a data-driven one can seem daunting, but it can be broken down into manageable steps. This framework provides a clear path for any department, regardless of its current technical maturity.
- Define Your “Support” Functions and Services. Before you measure anything, you need to know what you’re measuring. Sit down with the team (be it HR, Finance, or Ops) and identify the primary types of requests you handle. For an HR team, this might be “Payroll Inquiry,” “Benefits Question,” and “Recruiting Support.” This categorization is the foundation for all meaningful analysis later on.
- Standardize Your Intake Process. How do people ask you for things? If the answer is “email, chat, phone calls, and stopping by my desk,” you have a problem. You need a single, consistent channel, or a small number of well-defined channels, for requests to be submitted. This could be a dedicated email address that automatically creates tickets, a simple form on your company intranet, or a more advanced service portal. The goal is to get every request into one system.
- Choose the Right Tool for the Job. You don’t necessarily need a massive, expensive platform from day one. The right tool depends on your scale and complexity. You could start with a simple project management tool that has form integrations. As you mature, you may look at dedicated IT Service Management (ITSM) or case management platforms from providers like Salesforce or Atlassian. The key is that the tool must be able to track creation time, response time, resolution time, and status for every single request.
- Establish Your Baseline Metrics. Don’t start making changes on day one. Run your new intake process and tracking system for at least 30 days to collect baseline data. This gives you an honest, data-backed starting point. What is your actual average response time right now? How big is your backlog? Without this baseline, you have no way to measure the impact of your future improvements.
- Configure Your Dashboard for Visibility. Now you can build your dashboard. It should be simple and display the “big three” metrics prominently. Key widgets to include are: Total Open Tickets, Tickets by Age (Backlog), Average First Response Time (Today/This Week), and Average Resolution Time (This Week/This Month). Make this dashboard visible to the entire team so everyone understands the goals and can see the impact of their work.
- Review, Iterate, and Act. Data is useless without action. Schedule a recurring meeting, perhaps weekly or bi-weekly, to review the dashboard. This meeting should not be about assigning blame. It should be about identifying trends and solving problems. Ask questions like: “Why did our resolution time for invoice queries spike last week?” or “We have a growing backlog of new user setup requests. Do we need to automate part of that process?”
From Raw Data to Actionable Insights
A dashboard is just a collection of numbers until you use it to make better decisions. The true power of tracking these metrics comes from connecting the data to specific operational improvements. Let’s look at how different departments can translate dashboard insights into tangible business value.
Scenario: The Finance Department’s Invoice Queries
The Problem: The finance team feels constantly overwhelmed by emails from vendors and internal managers asking about the status of invoices. The process feels inefficient, but they have no data to prove it.
Dashboard Insight: After implementing a simple ticketing system, the dashboard quickly reveals that “Invoice Status Inquiry” is their highest volume request type and has an average resolution time of three days, as it requires manually checking multiple systems.
The Actionable Insight: The delay is caused by a manual, repetitive process. Instead of hiring more people, the team can focus on automation. They can implement a simple, automated workflow that, upon receiving a ticket with keywords like “invoice” and “status,” automatically queries the accounting system and sends a reply with the payment date. This drastically cuts resolution time, reduces the team’s manual workload, and improves satisfaction for both vendors and internal stakeholders.
Scenario: HR Operations and Employee Onboarding
The Problem: New hires have a frustrating onboarding experience, and HR business partners are spending too much time answering the same basic questions over and over.
Dashboard Insight: The HR dashboard shows an extremely high First Response Time (over 24 hours) for tickets in the “New Hire Questions” category. The backlog for this category also spikes during the first week of every month, coinciding with new hire cohorts.
The Actionable Insight: The team is reactively answering predictable questions. They can use this data to build a proactive solution. This could involve creating a detailed FAQ page for new hires, setting up an automated email sequence that answers common questions during their first week, or implementing a simple chatbot on the intranet to provide instant answers to Tier-1 questions. This frees up the HR team to focus on more strategic, high-value onboarding activities.
The Role of AI and Automation: Enhancing, Not Replacing
Artificial intelligence and automation are powerful tools for optimizing any support function, but they must be applied thoughtfully. The goal is not to replace human expertise but to augment it, handling the repetitive and predictable work so your team can focus on complex, high-judgment tasks.
Here are three practical ways to leverage these technologies:
1. Intelligent Triage and Routing: Instead of a manager manually reading every new request and assigning it to a team member, an AI model can analyze the text of the incoming request. Based on keywords, historical data, and the requester’s department, it can automatically categorize the ticket (e.g., “Software Access,” “Hardware Failure”), set its priority, and route it to the correct specialist or team. This shaves hours off response times and ensures the request gets to the right person faster.
2. Agent Assist and Suggested Responses: When a team member opens a new ticket, an AI tool can surface relevant information in real-time. This could include links to knowledge base articles that solve similar issues, approved email templates, or step-by-step resolution checklists. This doesn’t write the response for them, but it gives them the resources they need at their fingertips, leading to faster, more consistent, and more accurate resolutions.
3. Predictive Analytics for Backlog Management: By analyzing historical ticket data, machine learning models can identify patterns and predict future trends. For instance, it could forecast a 30% increase in password reset tickets in the first week of the quarter or flag a small but growing number of tickets related to a new software release, indicating a potential widespread bug. This allows teams to move from being reactive to proactive, staffing appropriately for predicted peaks or investigating potential problems before they become crises.
A Checklist for Safe AI Implementation
When implementing AI, especially with potentially sensitive employee or financial data, governance is key. Use this checklist as a starting point for a safe and effective rollout:
- Start with Low-Risk Tasks: Begin by automating processes that are high-volume, repetitive, and have low business risk, such as categorizing tickets or providing links to public knowledge articles.
- Keep a Human in the Loop: For any process that involves sensitive data or makes a critical decision (e.g., approving a financial request), ensure a human reviews and confirms the AI’s recommendation before final action is taken.
- Be Transparent: Clearly indicate when an employee or external user is interacting with an automated system or chatbot. Transparency builds trust and manages expectations.
- Enforce Access Controls: Ensure your AI tools adhere to the same role-based access controls as your other systems. An AI should not be able to access data that a human agent in the same role would be unauthorized to see.
- Audit and Review Regularly: AI models are not “set it and forget it.” Regularly audit their performance, accuracy, and the data they are using to ensure they are functioning as intended and without bias.
Your Next Steps: Building a Data-Driven Support Culture
Implementing a support dashboard is more than a technical project; it’s a cultural shift toward transparency, accountability, and continuous improvement. It provides a common language for teams to discuss their workload, justify requests for resources, and demonstrate their impact on the broader business.
Getting started doesn’t require a six-month implementation project. You can begin small and build momentum. Here is a simple plan to get started:
- Pick One Team, One Process: Choose a single internal team that is feeling overwhelmed, such as IT helpdesk or HR operations. Focus on their single highest-volume request type.
- Start Tracking Manually (If Needed): You don’t need a perfect system to start. Use a shared spreadsheet or a basic project board to log every new request, the time it was received, the time it was first answered, and the time it was closed.
- Review the Data After 30 Days: At the end of the month, sit down with the team and calculate your first-ever baseline for response time, resolution time, and backlog.
- Ask “Why?” and Identify One Improvement: Look at the data and find one bottleneck. Is the response time too long? Is a specific request type taking forever to resolve? Brainstorm one concrete process change you can make to improve that single metric.
By taking this incremental approach, you prove the value of data, build confidence in the process, and lay the foundation for a more efficient, scalable, and responsive organization. You stop guessing where the problems are and start knowing.
Your Next Read:
Category:
Get a FREE
Proof of Concept
& Consultation
No Cost, No Commitment!
