Intelligex Logo
Intelligex Logo
Get A Consultation

Data, Analytics & Reporting

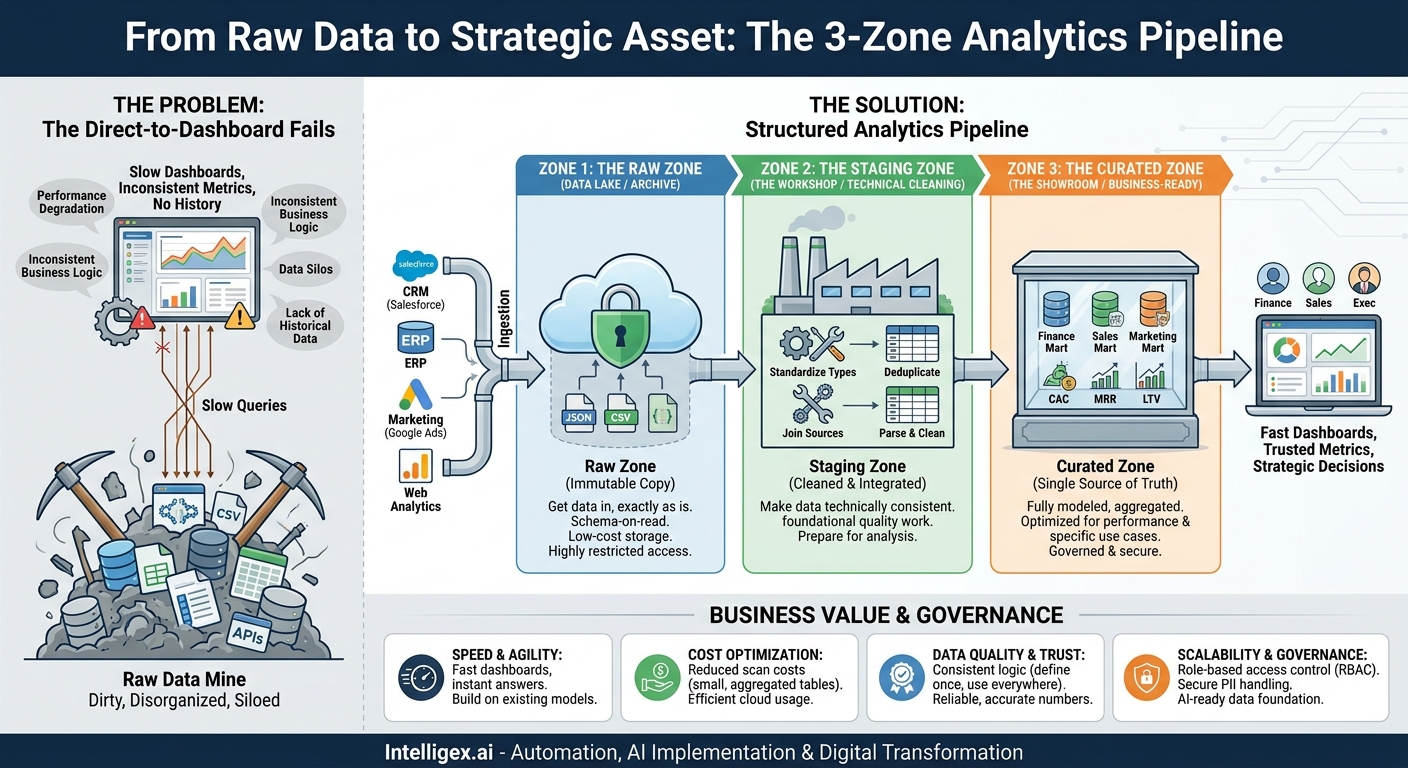
From Raw Data to Strategic Asset: The 3-Zone Analytics Pipeline

28 April 2026|Data, Analytics & Reporting|

Connecting business intelligence tools directly to raw operational systems creates slow dashboards, inconsistent metrics, and erodes trust in data. A structured analytics pipeline solves this by systematically refining data through three distinct zones—Raw, Staging, and Curated. This approach transforms chaotic data into a reliable, scalable, and strategic asset, providing a trustworthy foundation for all major business decisions.

From Data Chaos to Clarity: How to Build a Raw-to-Curated Analytics Pipeline

28 April 2026|Data, Analytics & Reporting|

Inconsistent data and slow dashboards often lead to meetings spent arguing about numbers instead of strategy. This article details a structured, three-stage (raw, staging, curated) analytics pipeline model that transforms messy source data into a trusted asset. By implementing this approach, you can dramatically improve data quality, increase the speed of insights, and build a reliable foundation for all business decision-making.

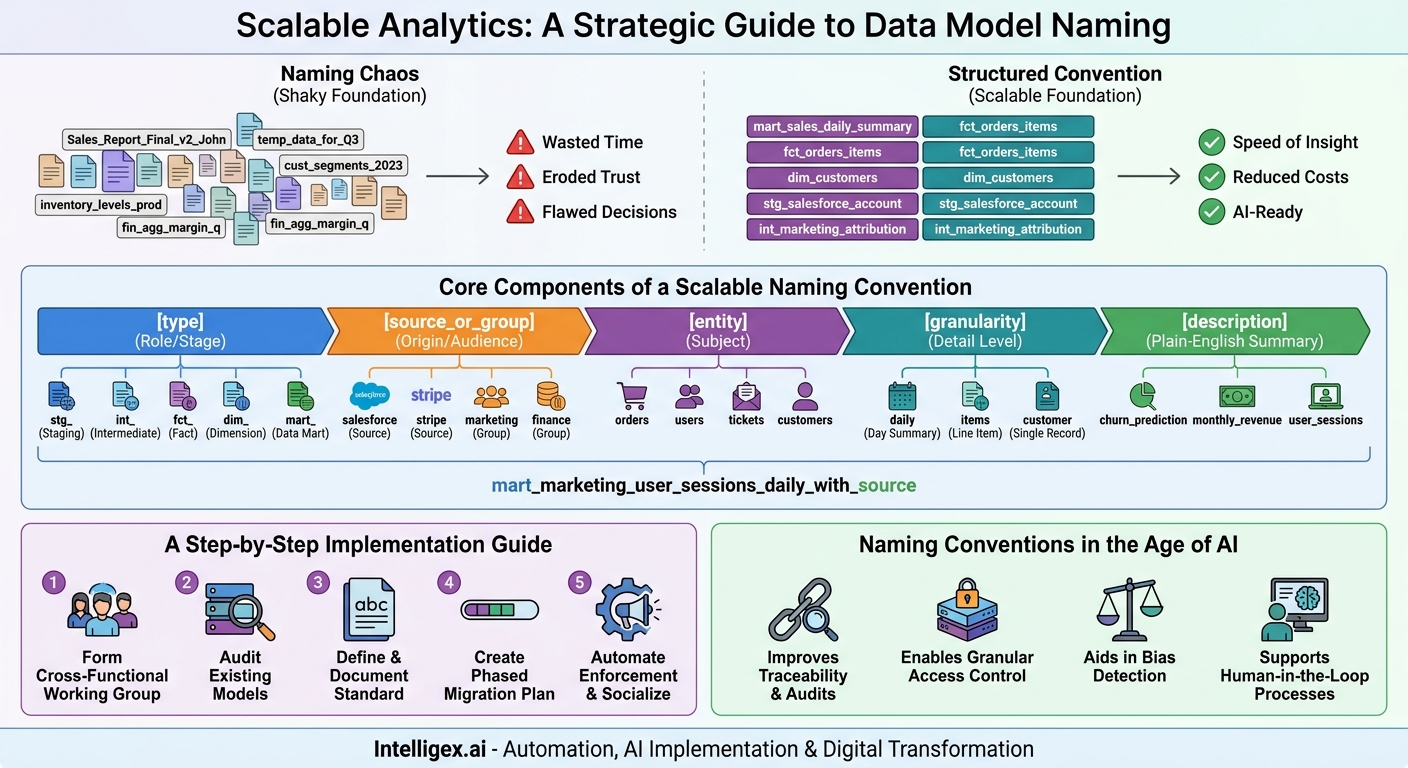
From ‘Sales_Final_v2’ to Scalable Analytics: A Strategic Guide to Data Model Naming

28 April 2026|Data, Analytics & Reporting|

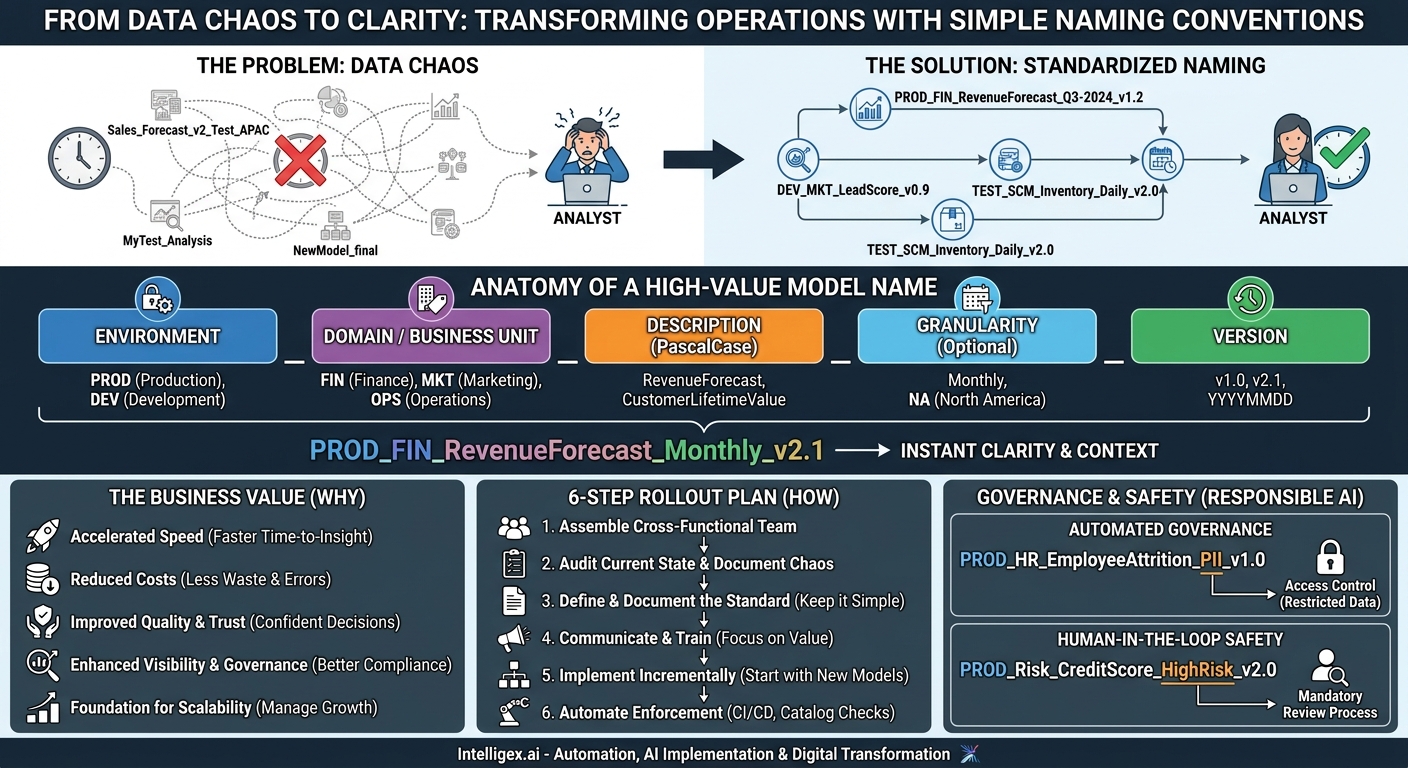
Ad-hoc data model names create widespread confusion, eroding trust and slowing down analytical teams. Implementing a standardized naming convention provides a universal language for your data, enabling users to find, understand, and trust information quickly. This simple discipline increases the speed of insight, reduces operational costs, and builds a scalable foundation for reliable reporting and advanced AI.

How a simple naming convention can transform your data operations

28 April 2026|Data, Analytics & Reporting|

Inconsistent data model names lead to costly errors, wasted time, and a lack of trust in your analytics. Implementing a disciplined, standardized naming convention is a foundational practice for any high-performing data team. This approach brings clarity to your data ecosystem, accelerating time-to-insight, improving governance, and enabling your analytics function to scale effectively.

How to Build a Data Quality Scorecard That Drives Business Value

27 April 2026|Data, Analytics & Reporting|

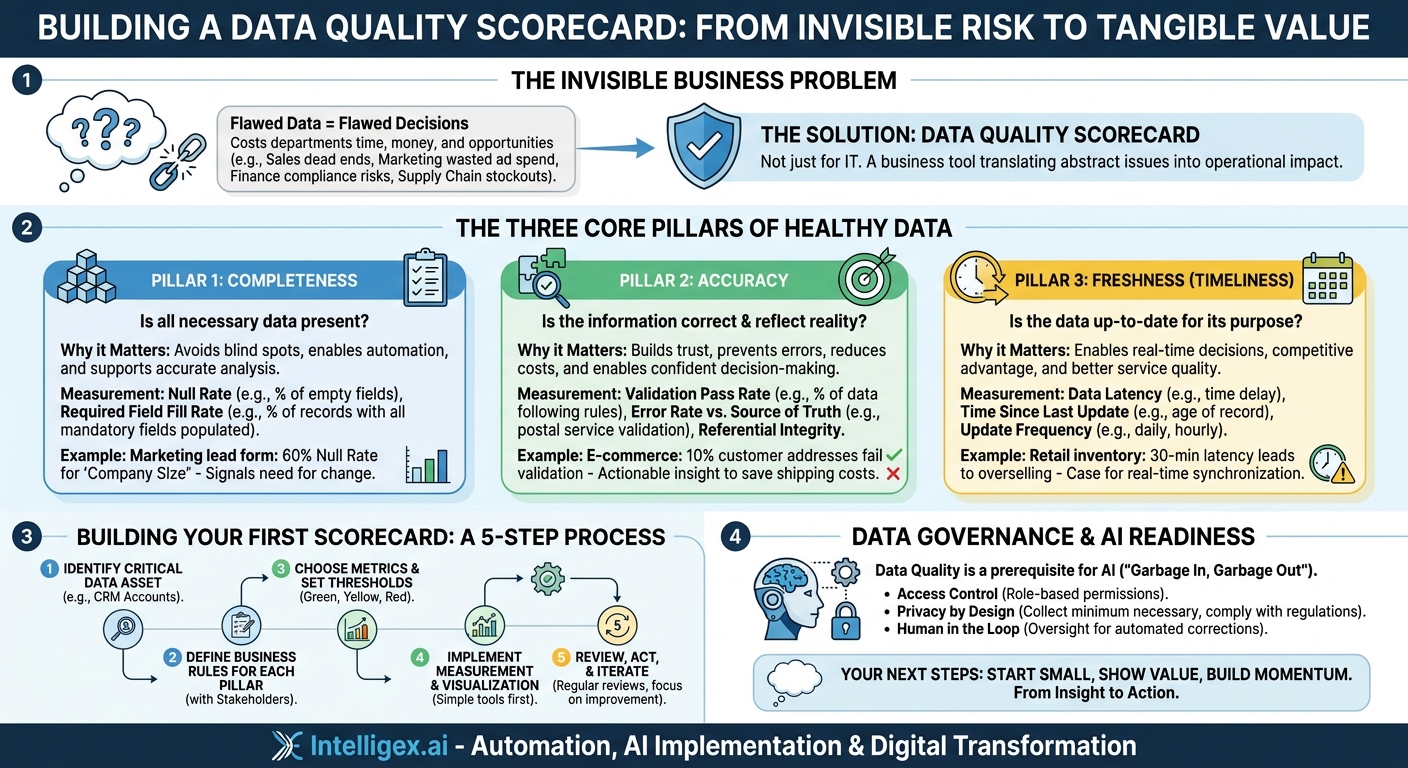
Making decisions based on flawed data is worse than relying on intuition, creating a false sense of confidence. The solution is a Data Quality Scorecard, a business tool that translates abstract data issues into tangible operational impact. By focusing on three core pillars—Completeness, Accuracy, and Freshness—you can create a shared understanding of your data's health and build a practical roadmap for improvement.

From ‘Garbage In, Garbage Out’ to Trusted Data: Your Guide to a Data Quality Scorecard

27 April 2026|Data, Analytics & Reporting|

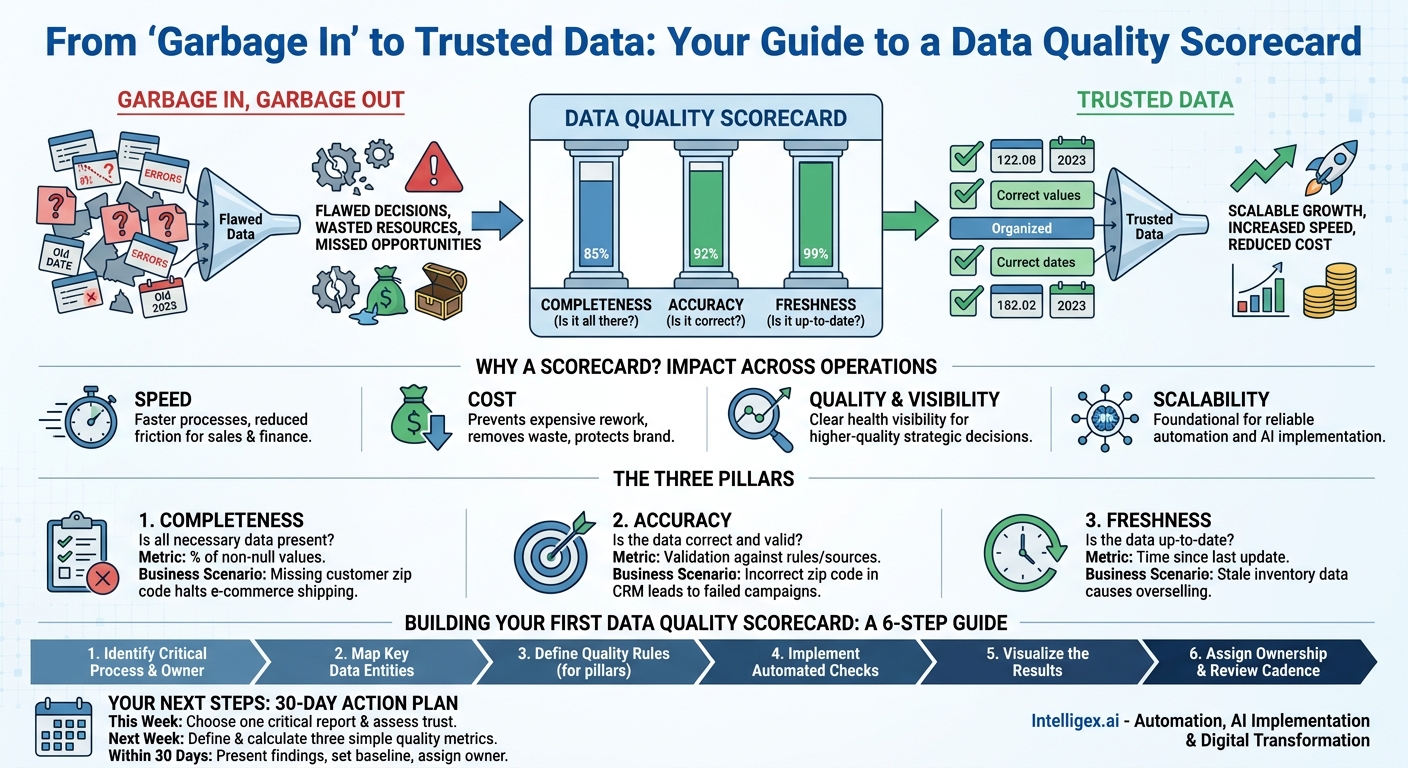
Many organizations passively accept the risks of poor data quality, leading to flawed decisions and wasted resources. A Data Quality Scorecard transforms this abstract problem into a tangible management tool for continuous improvement. By focusing on three core pillars—Completeness, Accuracy, and Freshness—this framework empowers teams to trust their data, accelerate key processes, and drive scalable growth instead of scalable chaos.

How a Metrics Layer Creates a Single Source of Truth for Your KPIs

27 April 2026|Data, Analytics & Reporting|

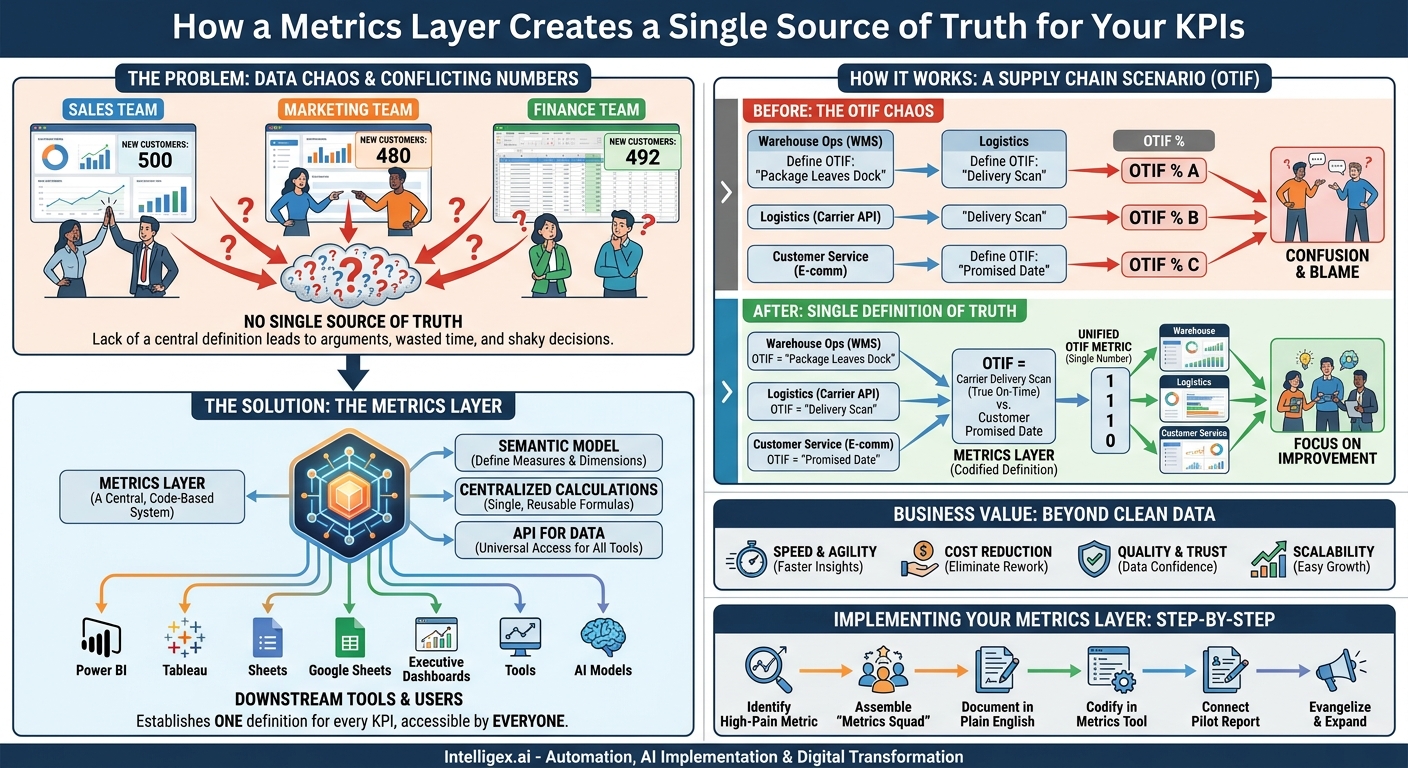
When sales, marketing, and finance report conflicting numbers for the same KPI, it erodes trust and slows down decision-making. The solution is a metrics layer, a centralized system that codifies business logic to create a single, reliable source of truth for your data. By defining metrics once and serving them to all your tools, you can end data arguments and empower teams to act confidently on consistent insights.

Stop Arguing About Data: How a Metrics Layer Creates a Single Source of Truth

27 April 2026|Data, Analytics & Reporting|

When sales, finance, and marketing all report different numbers for the same KPI, it's a sign of a data definition problem, not a people problem. The solution is a metrics layer, a centralized code base that provides a single source of truth for all business logic. By defining key metrics like revenue or churn once and using them everywhere, you eliminate confusion, build trust, and enable faster, more reliable decision-making across your organization.

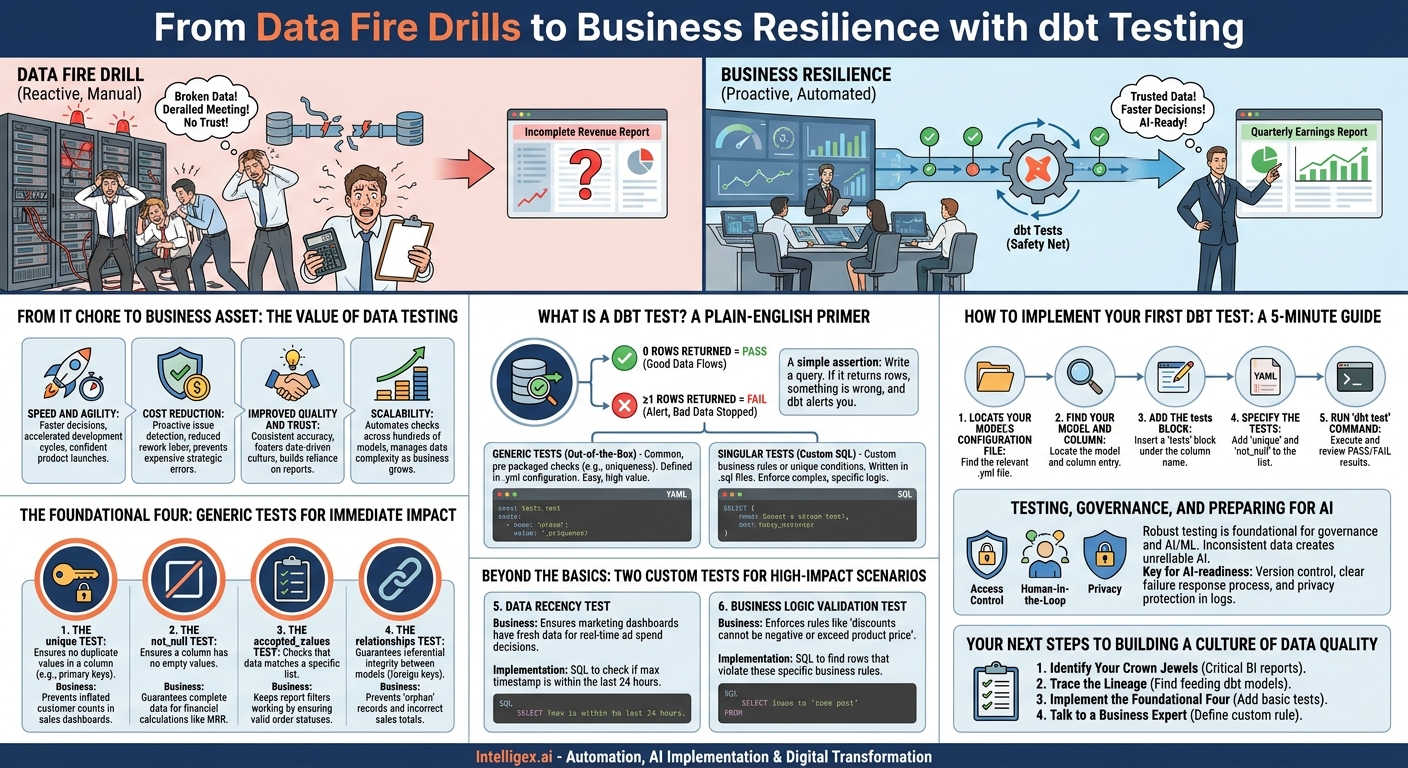
From Data Fire Drills to Business Resilience with dbt Testing

27 April 2026|Data, Analytics & Reporting|

Silent data pipeline failures can derail key business decisions and erode trust in your reports. Instead of relying on manual fire drills, modern data teams use dbt testing to automate data quality checks directly within their workflow. This proactive approach builds a safety net that catches errors early, ensuring business leaders can rely on accurate data for critical insights and strategy.

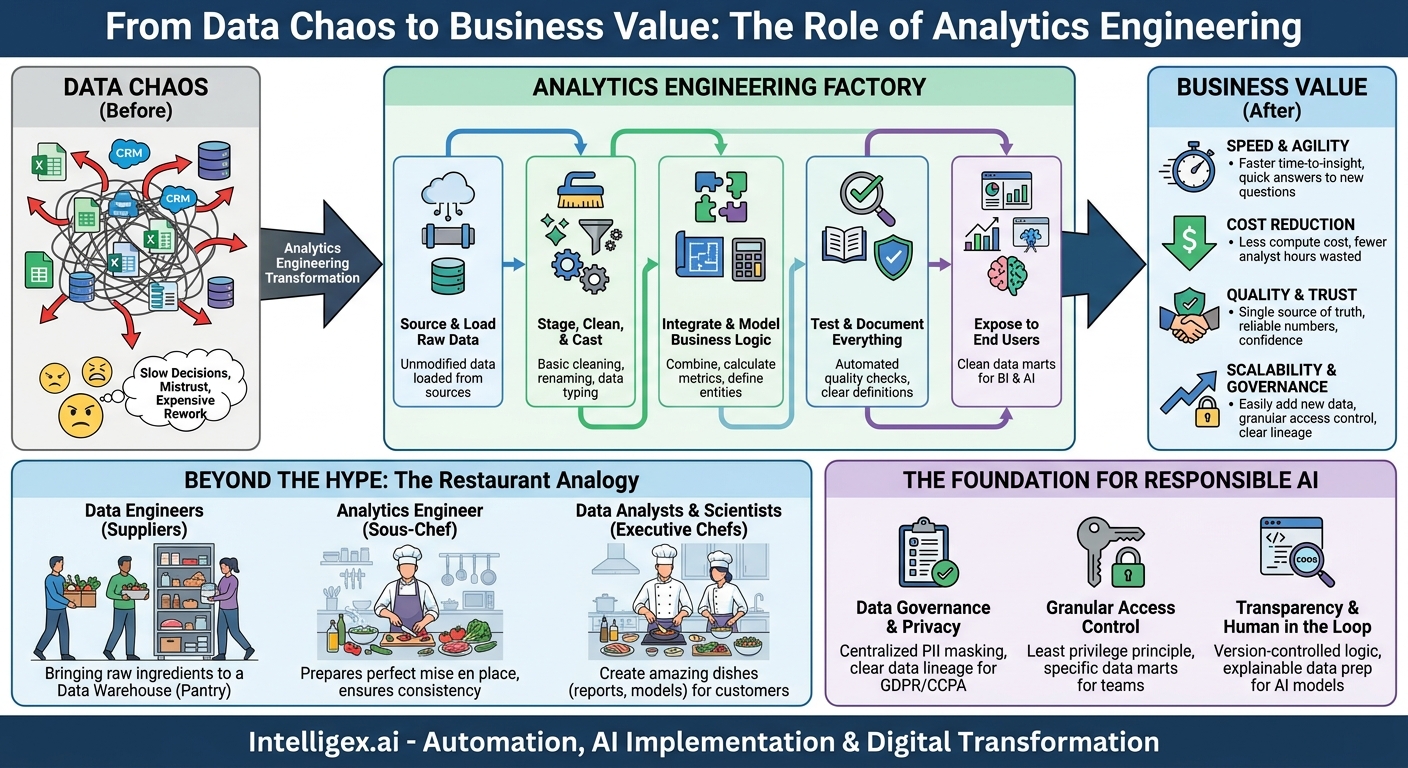
From Data Chaos to Business Value: The Role of Analytics Engineering

27 April 2026|Data, Analytics & Reporting|

Your teams are drowning in data but starving for insights, leading to slow decisions and a deep mistrust in reports. Analytics engineering solves this by applying software engineering principles to transform raw data into a reliable, tested, and documented single source of truth. This discipline creates a stable foundation that allows your organization to reduce costs, move faster, and finally make decisions with confidence.

Go to Top